
The Contract with Black Georgia: A Vision for Justice and Equality
Introduction
Georgia's African-American community has stood strong and resilient despite overwhelming obstacles. From voting hurdles to systemic barriers, the community has fought tirelessly for democracy. Now, it is time to forge a new path forward. The Contract with Black Georgia presents an action-oriented roadmap to facilitate justice, equality, and enhanced quality of life for Black Georgians.
Economic Index
Financial barriers often have a far-reaching impact on the lives of Georgia's African-American community, affecting their livelihoods and their potential to realize dreams and aspirations. This section deeply explores the complexities of income inequality, high unemployment rates, and the immense wealth gap that has persisted across generations. Additionally, it sheds light on the hurdles faced in accessing credit and the profound link between education and opportunities, thereby emphasizing the interconnectedness of these economic challenges.
The financial challenges affecting African-Americans in Georgia are multifaceted and profound. It's more than statistics; it's about real lives and opportunities stifled.
- Income Inequality: A glaring gap in earnings reflects a complex challenge.
- Unemployment Rate: More than numbers, it's about dreams deferred.
- Wealth Gap: A disparity in wealth that echoes through generations.
- Access to Credit: Stories of families hindered from realizing their potential.
- Educational Attainment: A chain linking education to opportunities.
- Government Contracting: Navigating a maze where opportunities can be seized or missed in bureaucratic corridors.
Data from the state of Georgia provides an overview of income inequality across 159 counties in the state of Georgia, as measured by the income ratio. On average, the income of the top percentile is about 4.96 times that of the bottom percentile. There is a substantial variation in income inequality across different counties, with the income ratio ranging from 3.12 in the most equal county to 10.17 in the most unequal county. This suggests a significant disparity in income distribution across the state.
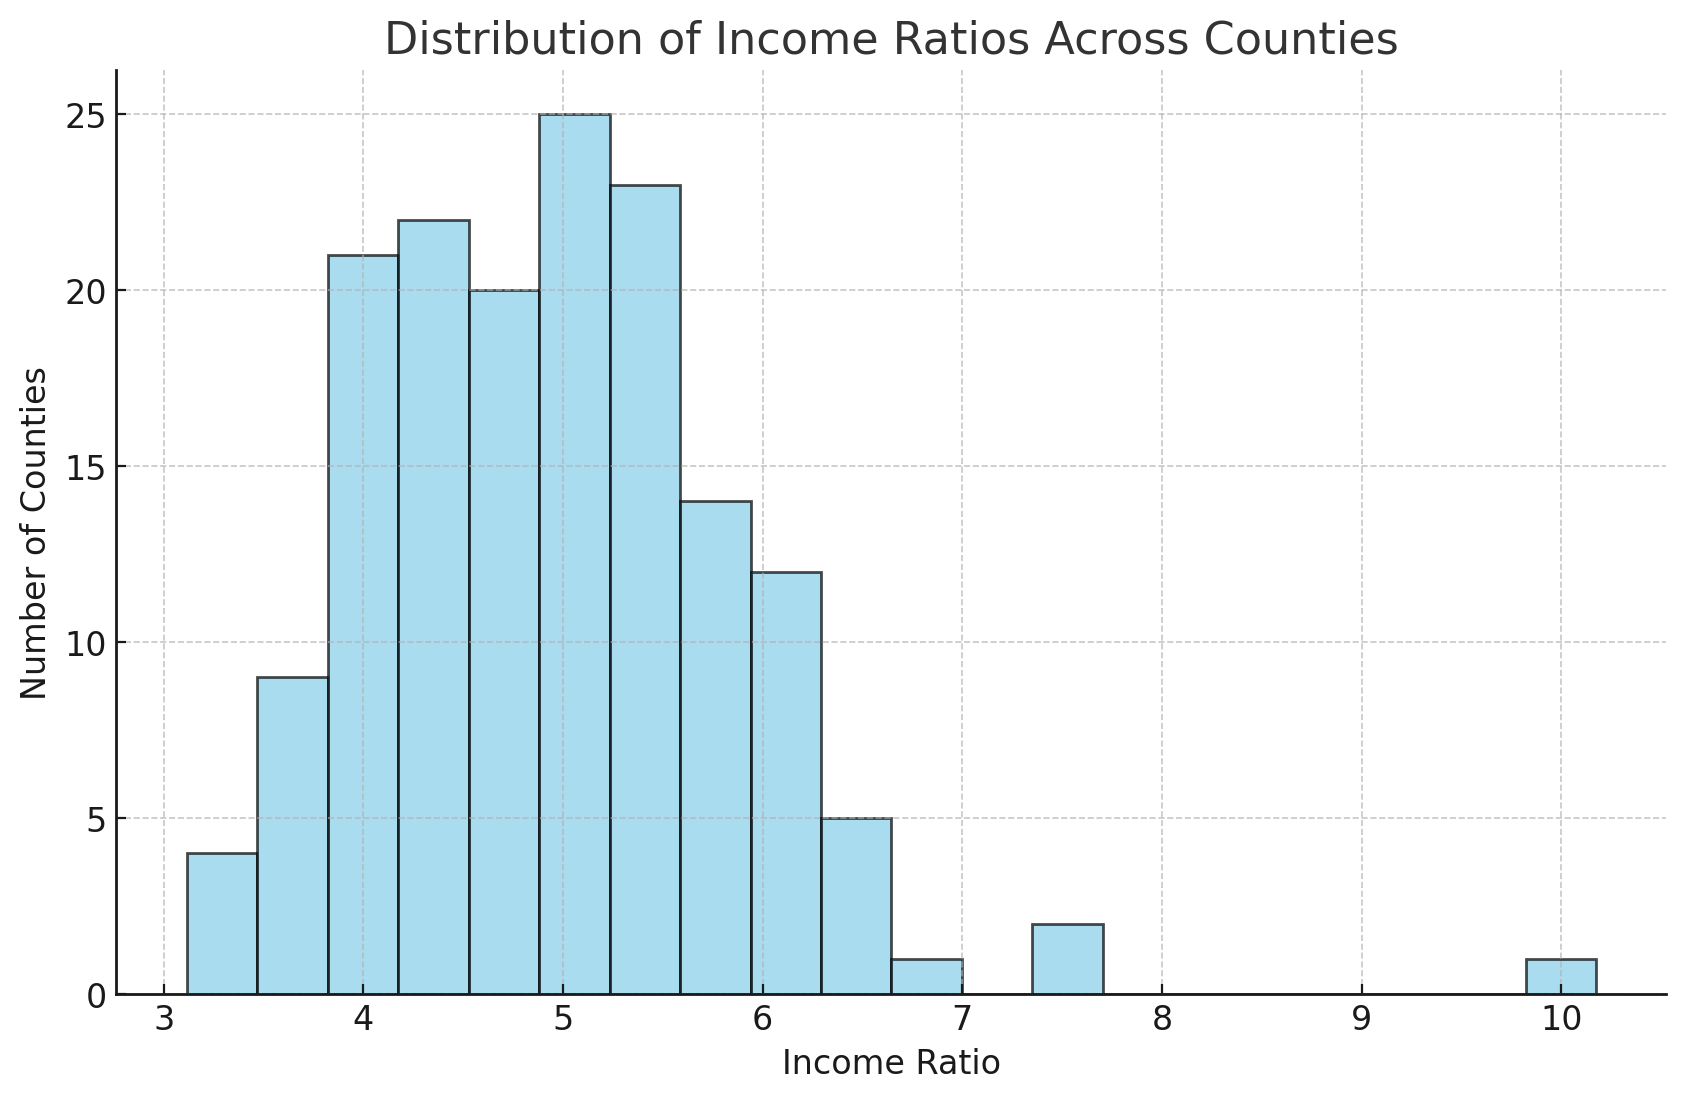
When visualized as a histogram, the distribution of income ratios across the counties displays a somewhat normal pattern but with a slight right skew. Most counties have an income ratio between 4 and 6. However, there are several counties where the income ratio exceeds this range, indicating a higher level of income inequality. One county has an income ratio of approximately 10, representing extreme income disparity.
Georgia Income Distribution by County
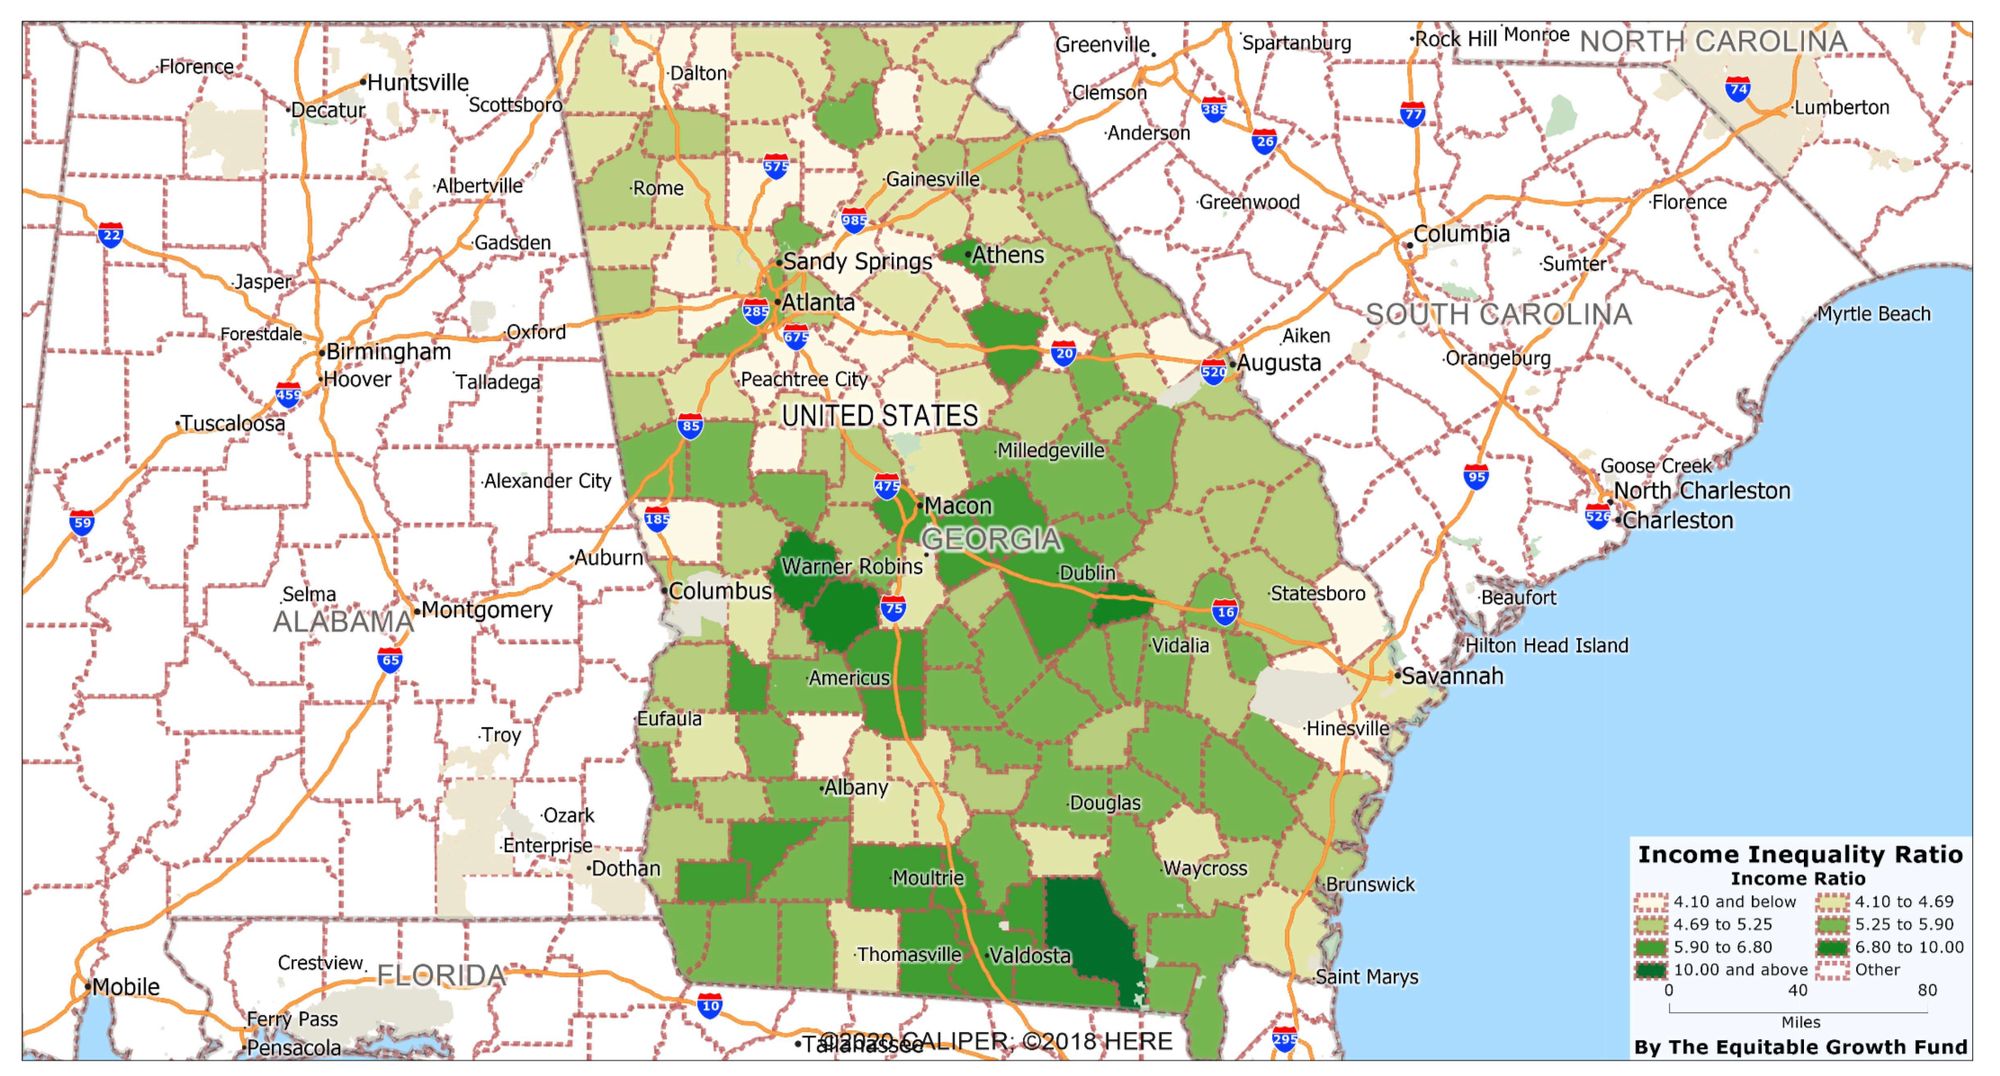
There is a considerable degree of income inequality across counties in Georgia, with a significant difference between the most and least unequal counties. This analysis provides valuable insights into the economic conditions across different state regions. Further studies could extend this analysis to other states or regions or investigate potential correlations with other socioeconomic factors to understand the drivers of income inequality better.
Social Index
Social factors significantly impact the Black community's quality of life and opportunities in Georgia. Our communities' vibrant social fabric holds the potential to be a force for unity, progress, and shared prosperity. Yet, deeply ingrained patterns of institutionalized racism, voter suppression, inadequate mental health support, and disproportionate incarceration rates threaten this potential, casting long shadows of injustice and bias. This section will delve into these critical social factors, unearthing the systemic inequities that inhibit the full participation of the Black community in Georgia's social life.
The social tapestry that binds our communities is marred by injustice and bias:
- Institutionalized Racism: A dark shadow looming over our society.
- Voter Suppression: Voting, a right earned through struggle, was thwarted.
- Mental Health Support: An unspoken issue seeking voices and care.
- Incarceration Rates: Families torn apart, futures dimmed.
- Reentry Initiatives: A bridge back to society, mending shattered hopes and dreams.
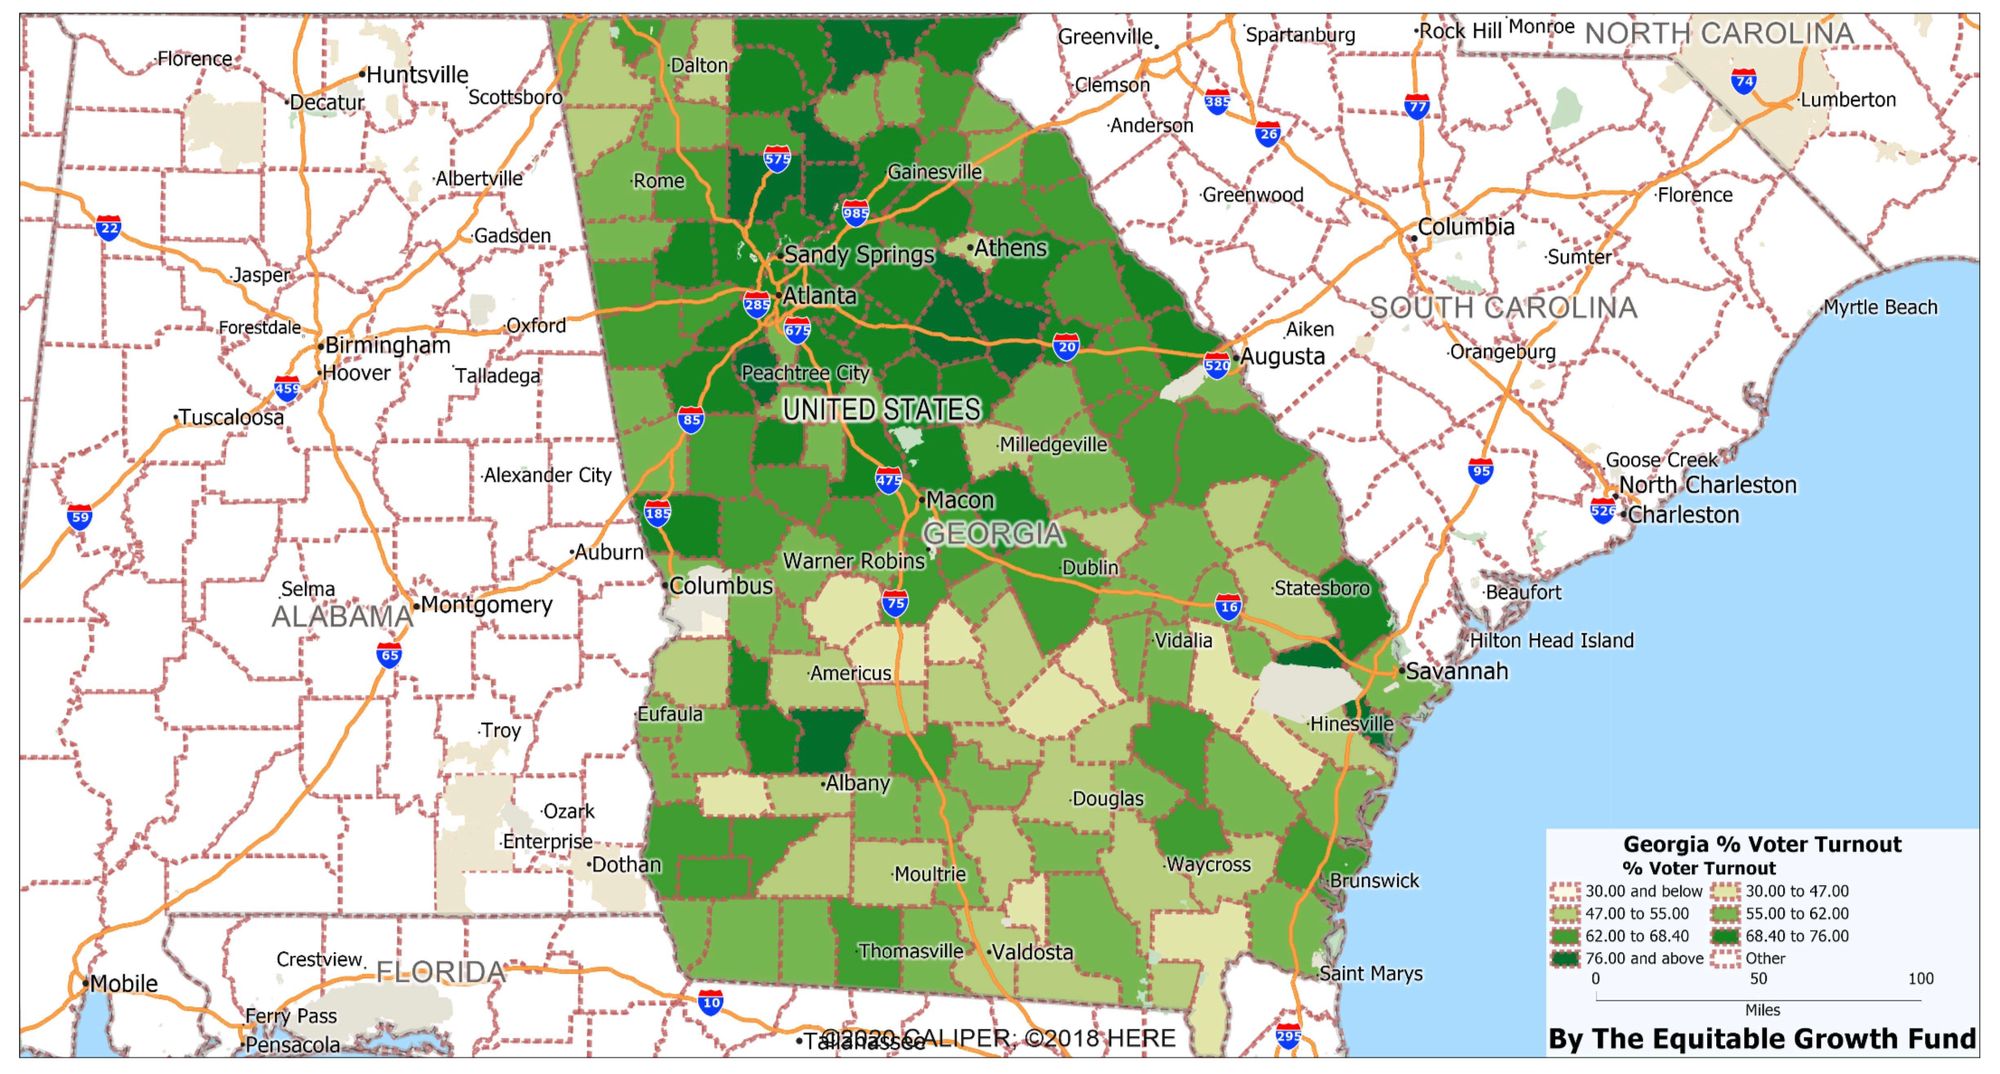
Georgia Percent Voter Turnout
Environmental Index
Environmental factors are crucial in determining Georgia's Black community's quality of life and health outcomes. These challenges range from environmental racism and limited access to green spaces to the disproportionate impacts of climate change on our communities. This section will explore these issues in depth, highlighting the urgency to address these systemic environmental disparities.
From the air we breathe to the parks where our children play, environmental factors hold significant sway:
- Environmental Racism: Toxicity that sickens more than just the body.
- Access to Green Spaces: A quest for tranquility often denied.
- Climate Change Impact: The looming storm, figuratively and literally.
- Brownfield Cleanup: Reclaiming land, restoring hope and health.
The dataset we've analyzed provides a snapshot of the average daily PM2.5 levels - a common measure of air pollution - across different counties in Georgia. Overall, the air pollution levels are relatively uniform across the state, with an average PM2.5 level of about 9.34 micrograms per cubic meter (μg/m³). Despite this overall uniformity, it's important to remember that this data might mask variations at a more local level, especially when comparing urban and rural areas.
Georgia Air Pollution by County

Urban areas like Atlanta (located in Fulton County) and DeKalb and Gwinnett counties are often associated with higher levels of air pollution due to increased human activity and urbanization. Factors contributing to this include higher emissions from vehicles and industrial processes, greater population density, geographical factors that can trap air pollutants, and fewer green spaces that can help absorb harmful pollutants. Cities like Macon and Savannah, which are also more densely populated, are likely subject to similar influences.
While our dataset provides a valuable overview of air pollution across Georgia, a more detailed investigation into PM2.5 levels in specific urban and rural areas would provide a clearer understanding of these trends. Especially in the more urbanized and densely populated counties and cities, it's likely that PM2.5 pollution levels are higher due to the various factors associated with urbanization and human activity. Further research or more detailed data would be needed to confirm and quantify these differences.
Health Index
Our health is one of the most valuable aspects of our lives, significantly influencing our capacity to live fulfilling, productive lives. Health goes beyond mere existence. It's about the quality of our lives, the opportunities we can seize, and the dreams we can realize. Yet, health disparities are persistent and troubling, particularly between Black Georgians and the general population.
The health of a community tells a story of care, empathy, and foresight:
- Healthcare Access: Seeking healing shouldn't be a struggle.
- Chronic Diseases: An affliction worsened by indifference.
- Infant Mortality Rates: Young lives lost, potential unfulfilled.
- Black Women's Health: Unique challenges, often overlooked or misunderstood.
- Black Men's Health: Struggles compounded by societal pressures and biases.
Based on an extensive analysis of health data across Georgia's counties, we found disparities that cannot and should not be ignored. The Years of Potential Life Lost Rate (YPLL) measures premature mortality, representing the years of life lost for those who die before a set age, in this case, 75.
According to the calculations, the average difference in YPLL between the general population and the African-American (Black) population across all counties in Georgia is approximately 5,375.06 years. In practical terms, this indicates that, on average, the rate of premature mortality is significantly higher for the Black population than the general population.
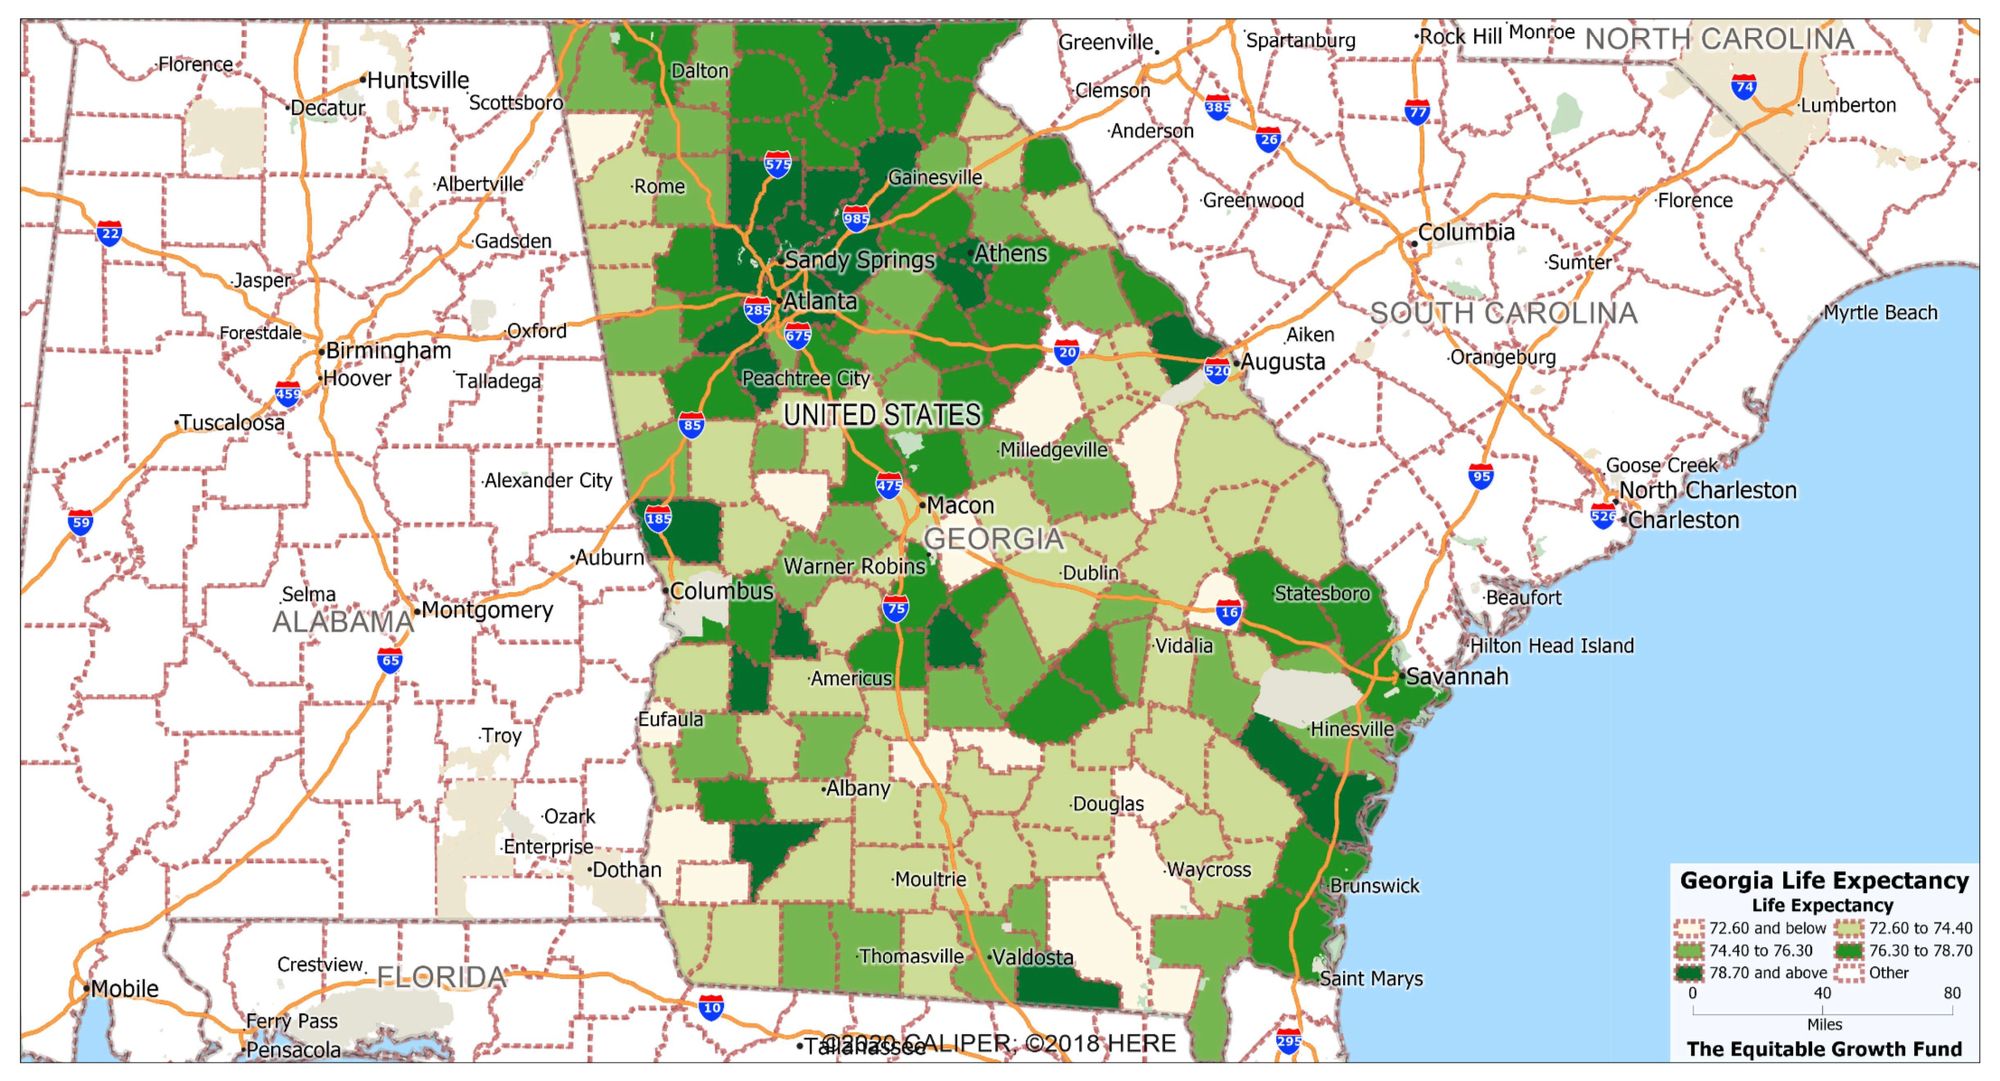
Life Expectancy by County
The median difference in YPLL, which is around 4,669.90 years, is slightly lower than the average. This discrepancy points towards the skewed distribution, where a few counties with exceptionally high differences pull up the average.
Difference Between Black and General Population Years of Life Lost
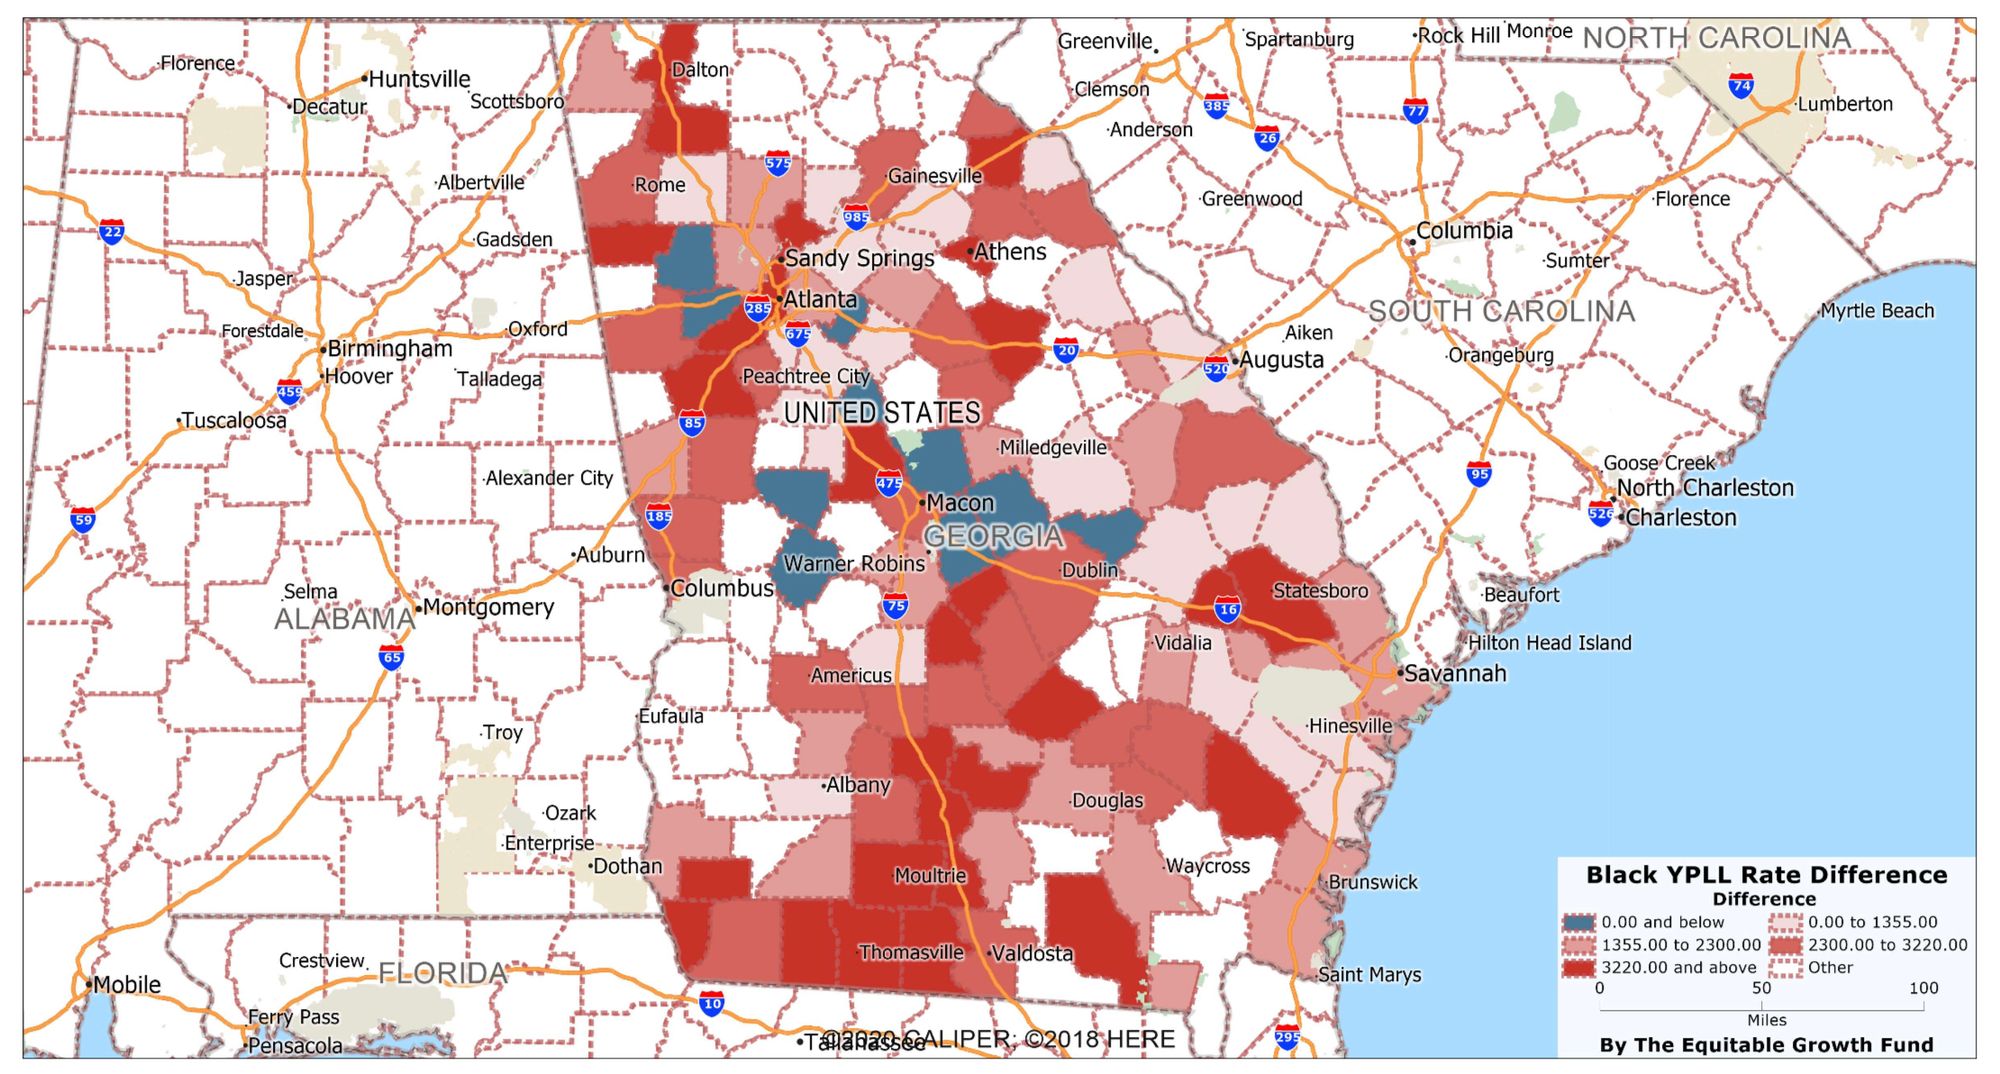
Further, the total difference in YPLL across all counties in Georgia amounts to a staggering 591,257 years. This alarming figure accentuates the sheer scale of disparity in premature mortality between the general population and the Black population across Georgia.
Georgia's Percent of Fair or Poor Health by County
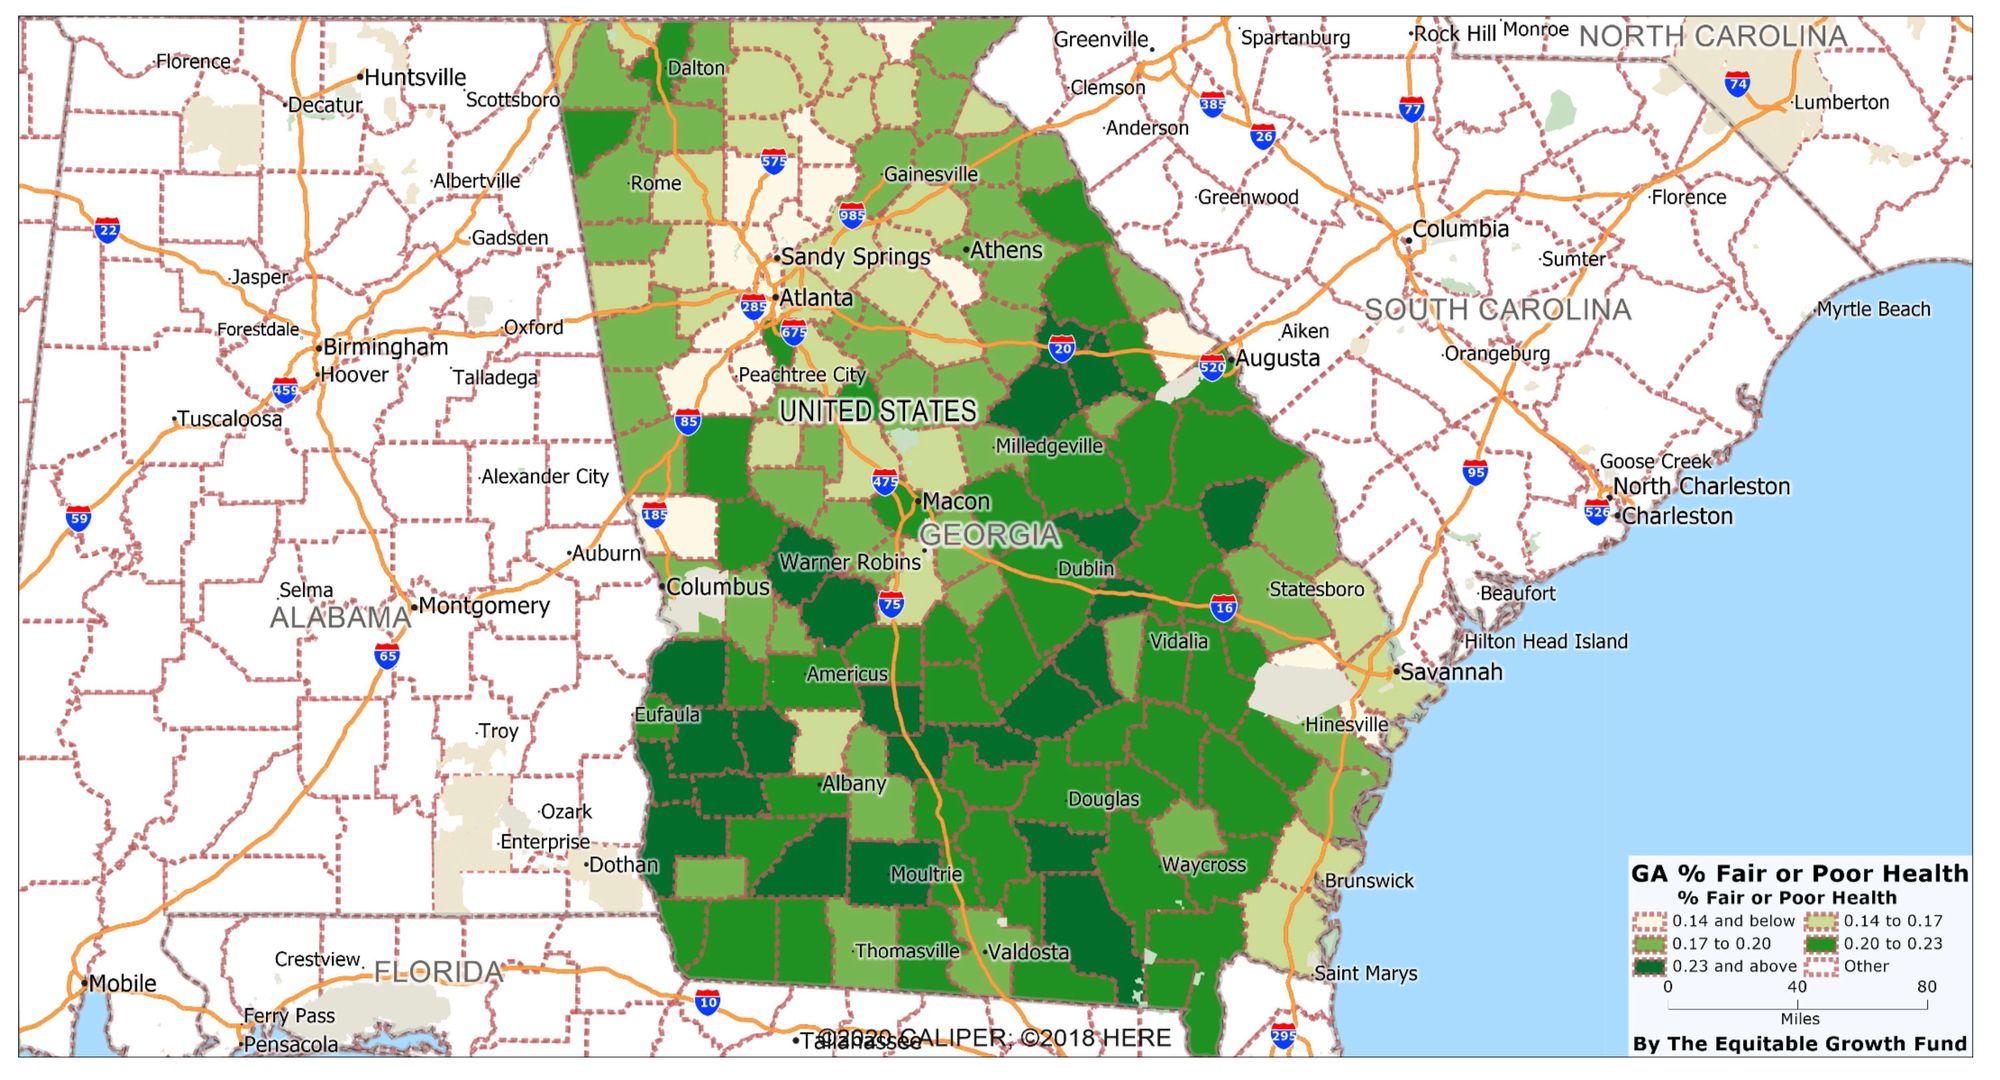
These disparities in YPLL rates potentially mirror the underlying inequities in factors that greatly influence health, like access to healthcare, quality of education, employment opportunities, and environmental conditions. As such, effectively addressing these disparities will likely necessitate comprehensive strategies that target these influential social determinants of health.
We will further delve into these and other factors that contribute to the health of Black Georgia. We will identify specific challenges and propose actionable solutions to advance health equity for Black Georgians. These factors will be included in the Contract with Black Georgia.
This is not just a call for awareness but a call to action for health equity, which is a right, not a privilege. Together, we can work towards a healthier, fairer Georgia.
Education Index
Despite the promise of education being an equalizer, the reality for Georgia's Black community is one of stark disparities. From an attainment gap that starts early and widens over time to a digital divide that leaves many of our youth behind, education inequalities persist. This section delves into these issues, including the chronic underfunding of schools in our communities, spotlighting the pressing need for reform.
Education, the great equalizer, yet a landscape filled with inequality:
- Educational Attainment Gap: A race where the starting line is staggered.
- Digital Divide: A modern divide widening with time.
- School Underfunding: No money, no hope.
- Higher Education Access: The bridge to advanced knowledge, often toll-gated.
- Early Childhood Education: The foundation of future success, yet not universally available.
- Historically Black Colleges and Universities (HBCUs): Beacons of Black excellence, yet often under-resourced.
Georgia School Funding Inadequacy
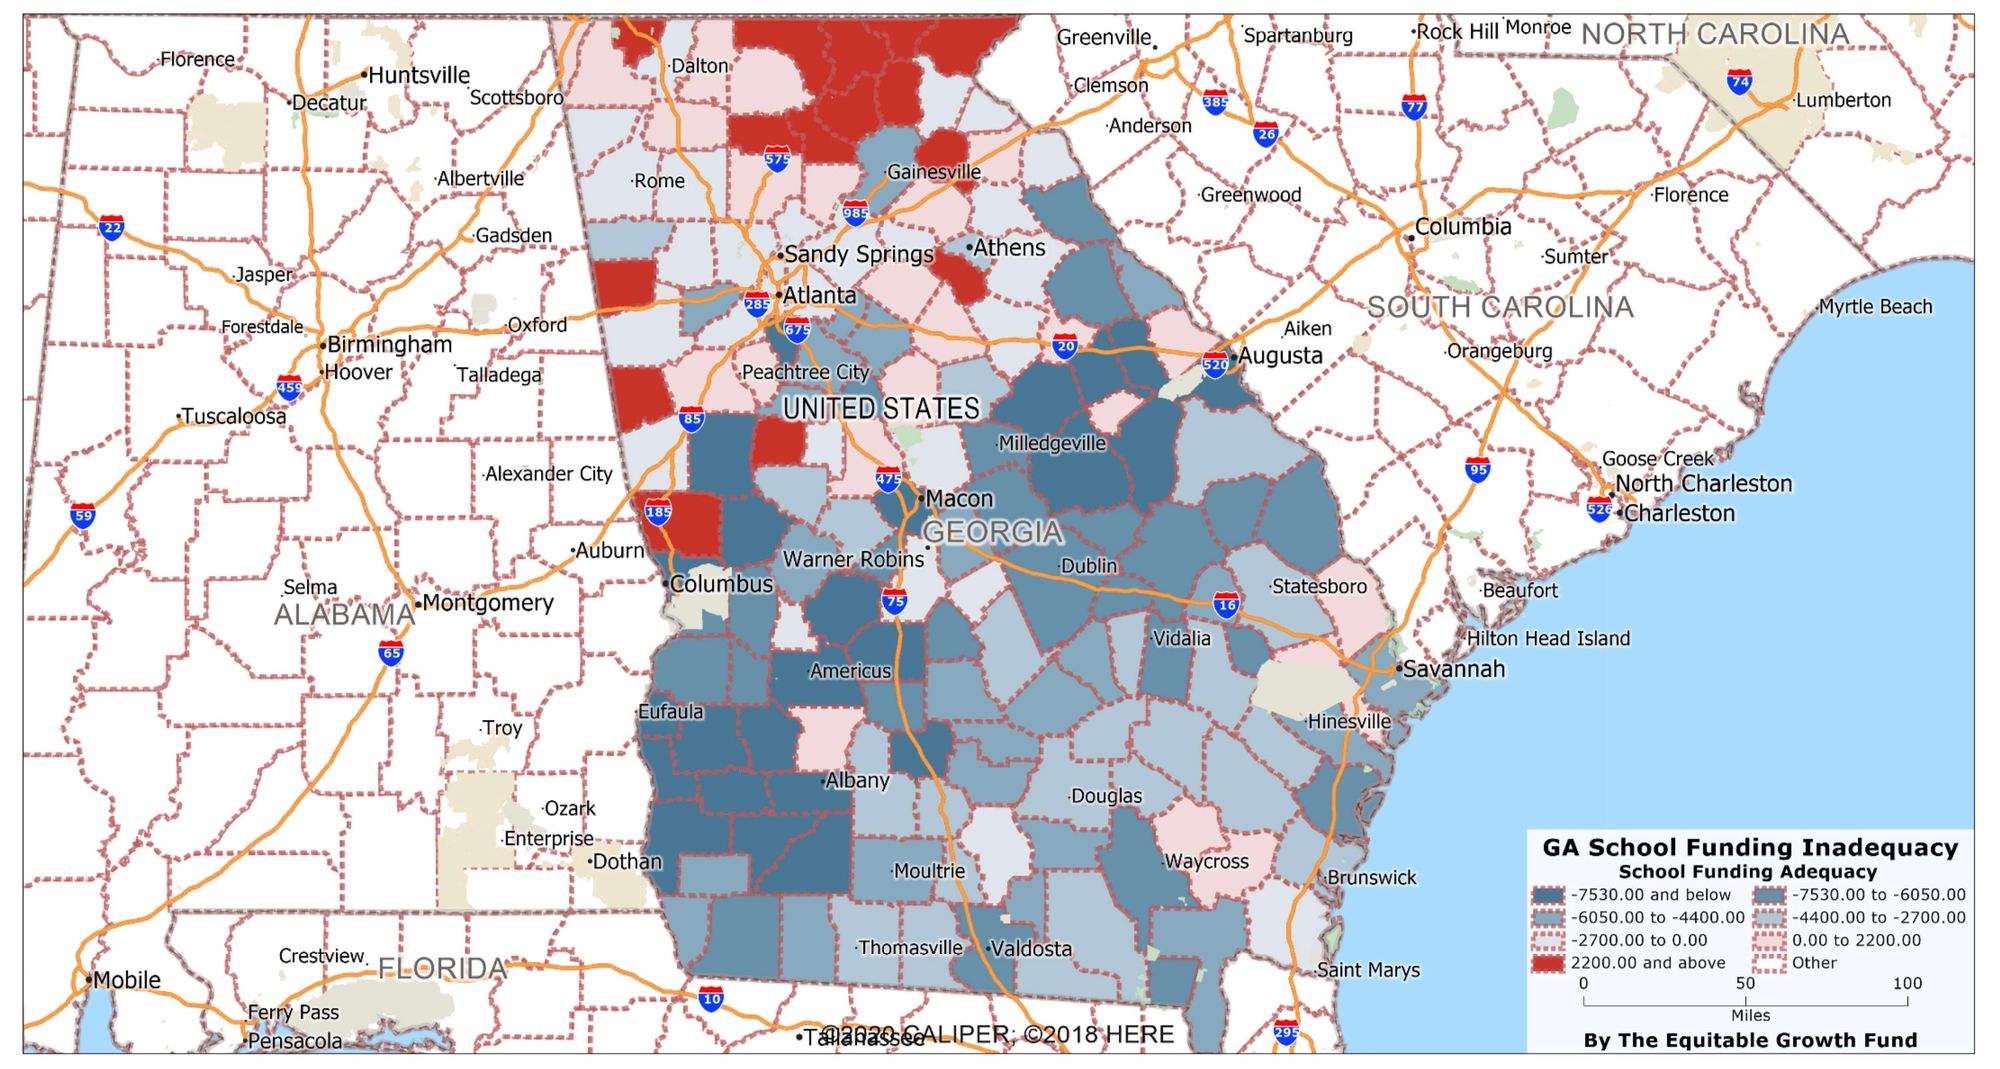
Here are the top 10 counties in Georgia with the highest school funding deficits:
- Terrell County: School funding adequacy of $-14,315.55, with a 60.4% Black population.
- Quitman County: School funding adequacy of $-14,127.49, with a 47.3% Black population.
- Warren County: School funding adequacy of $-13,413.24, with a 59.0% Black population.
- Calhoun County: School funding adequacy of $-12,781.14, with a 61.0% Black population.
- Clay County: School funding adequacy of $-11,902.01, with a 60.5% Black population.
- Randolph County: School funding adequacy of $-11,398.89, with a 61.5% Black population.
- Richmond County: School funding adequacy of $-11,144.86, with a 57.1% Black population.
- Talbot County: School funding adequacy of $-11,013.32, with a 55.0% Black population.
- Mitchell County: School funding adequacy of $-10,983.29, with a 48.1% Black population.
- Macon County: School funding adequacy of $-10,238.47, with a 31.7% Black population.
These counties exhibit a significant school funding deficit, with a high percentage of the Black population in most cases. This analysis reinforces the earlier negative correlation between the percentage of the Black population and school funding adequacy. It suggests that areas with higher Black populations tend to face more school funding challenges. As mentioned earlier, additional research would be needed to understand better the specific factors contributing to these funding disparities and to develop targeted interventions.
Infrastructure Index
Every robust community lies grounded on a strong and reliable infrastructure. This structure forms the foundation of a functional society, driving the quality of life for all its constituents. However, when such infrastructure is insufficient or absent, the most vulnerable populations face the maximum impact. This is especially true for the Black community in Georgia, where infrastructural disparities build significant barriers to their well-being and growth.
The Infrastructure category in our study underlines the crucial areas of health service deserts, food deserts, credit deserts, housing deserts, and digital/broadband access. Through their inherent character, each area reveals systemic disparities that hinder the progress of Georgia's Black population.
The concrete and cables that should connect us often divide:
- Health Service Deserts: Regions with limited or no access to essential healthcare services, resulting in difficulty receiving timely medical care.
- Food Deserts: Lack of access to affordable and nutritious food, leading to unbalanced diets and negative health impacts.
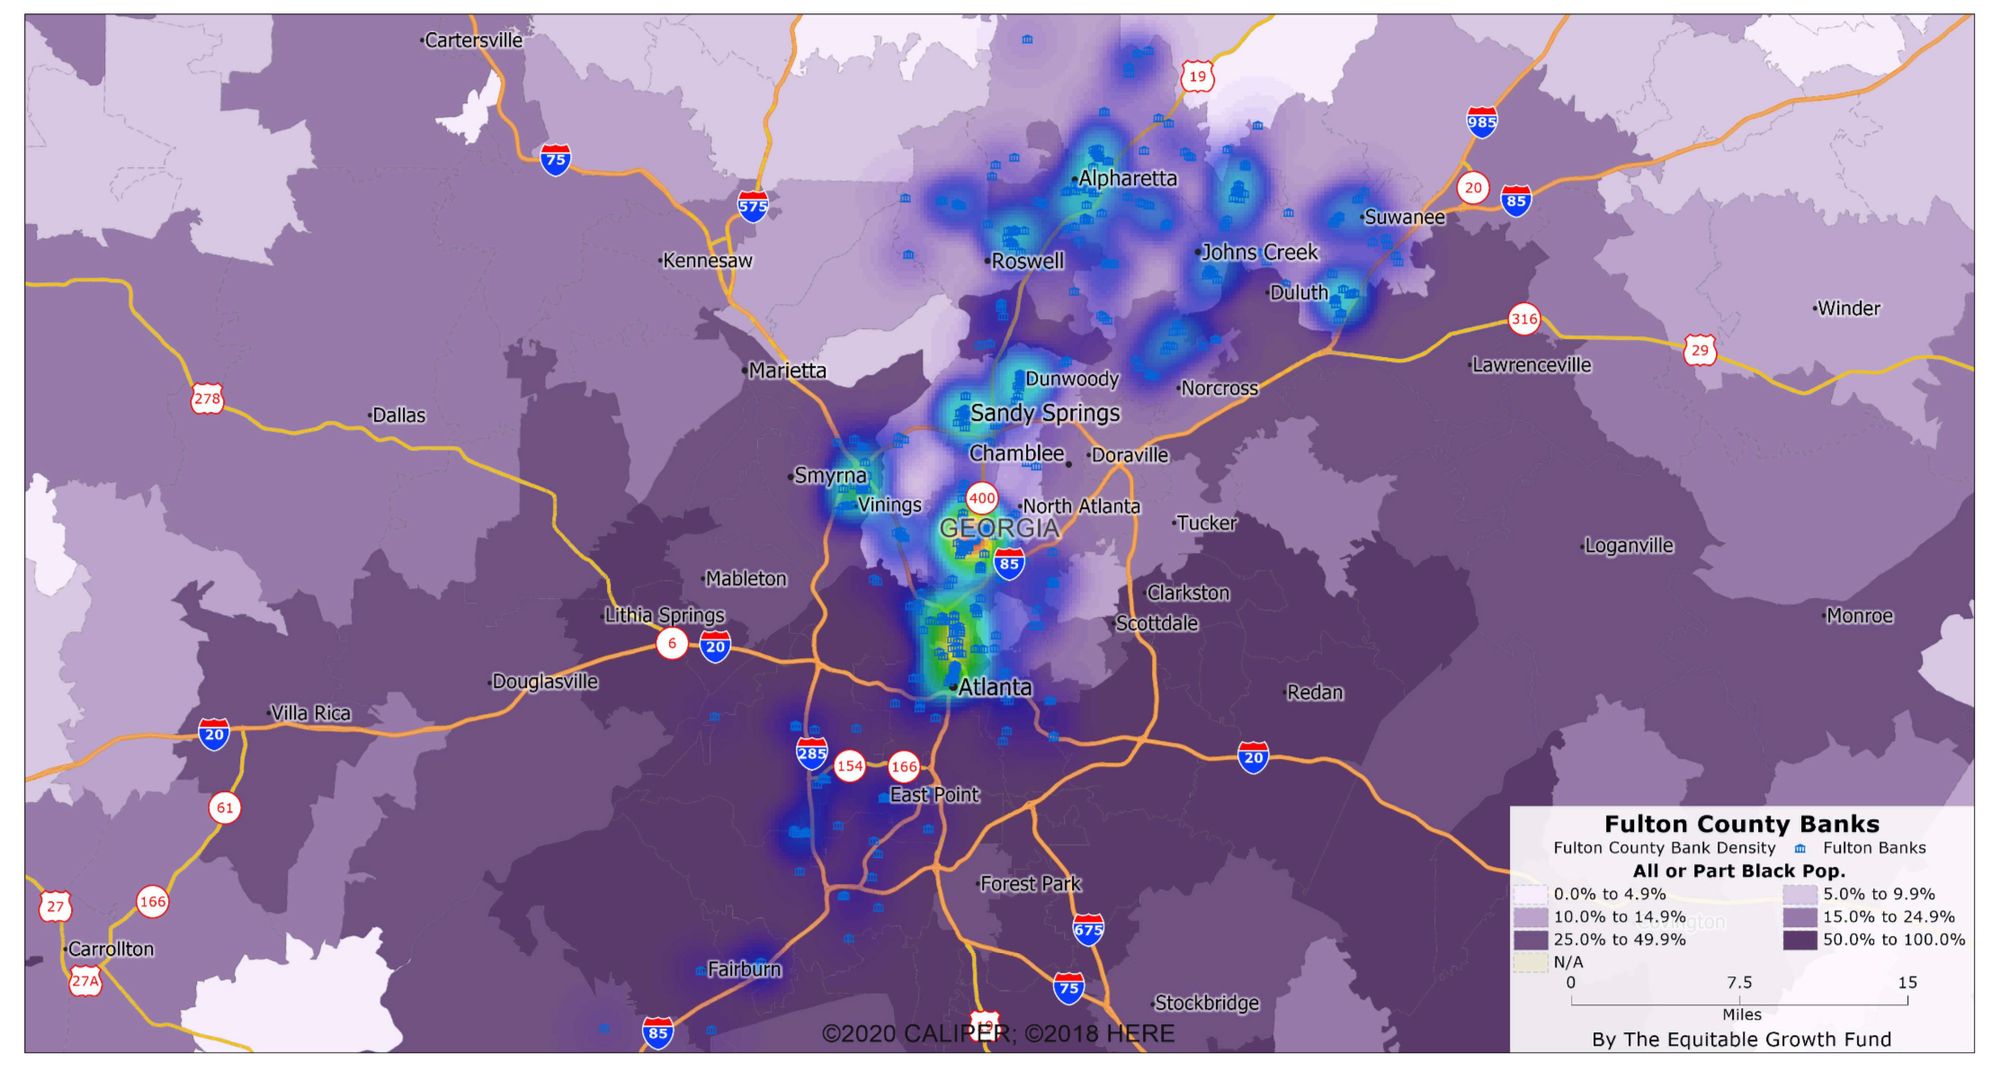
- Credit Deserts: Areas with scarce access to financial services like banking and credit, hindering economic growth and personal financial stability.
- Housing Deserts: Walls that segregate more than bricks.
- Digital and Broadband Deserts: The Internet is a right, not a privilege.
- Transportation Deserts: Building bridges for communities in need.
Health service deserts point to areas where quality healthcare is sparse or absent. Food deserts mark territories with limited access to affordable and nutritious food, contributing to food insecurity. Credit deserts encapsulate the failure of financial institutions, notably under the Community Reinvestment Act, to adequately address the needs of the Black community. Housing deserts spotlight regions grappling with housing affordability, distress, and related challenges. Lastly, a new facet of infrastructural equity has emerged in the digital age - access to reliable broadband internet services, which is crucial in today's interconnected world.
DeKalb County Pharmacy Deserts
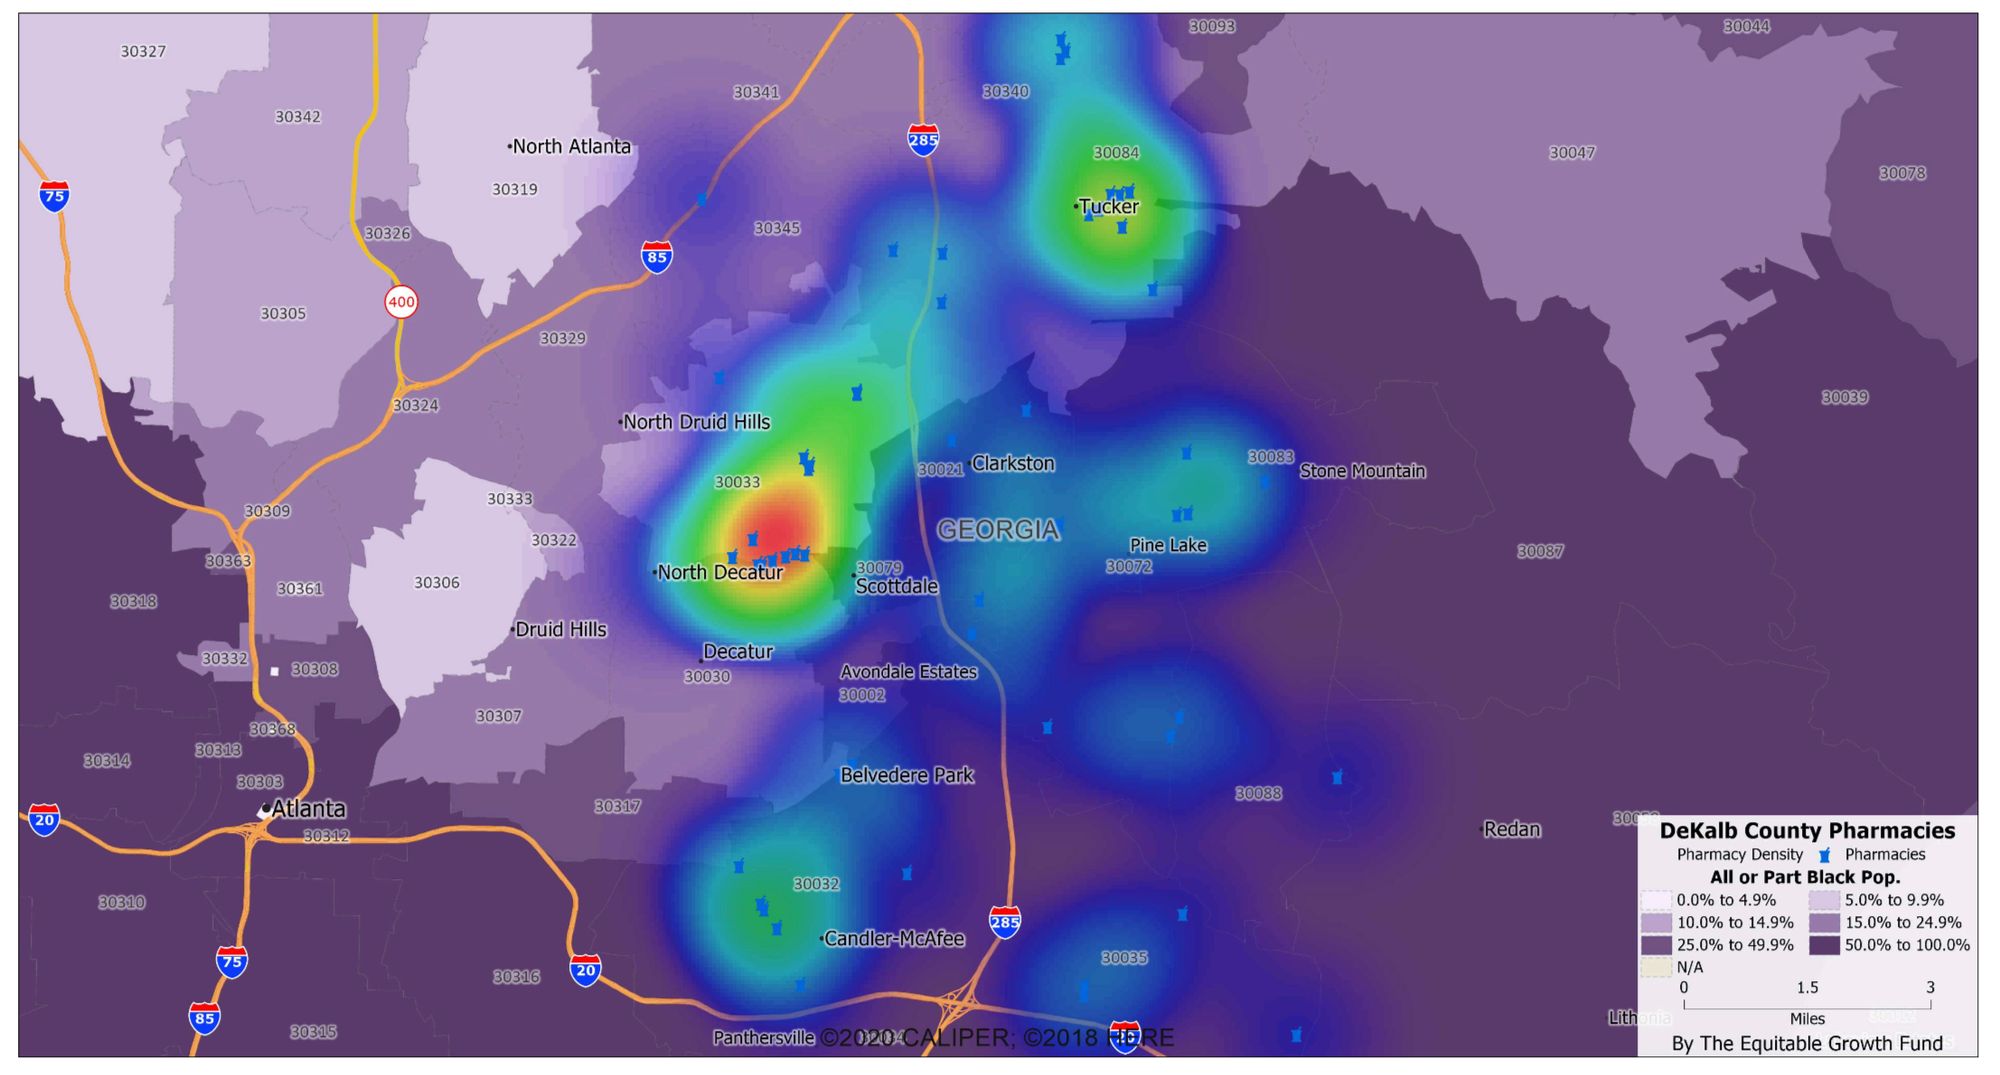
These "deserts" represent more than just a lack of essential services. They symbolize the often-unseen struggles of Georgia's Black population to secure basic resources.
Chatham County Grocery Stores/Food Deserts
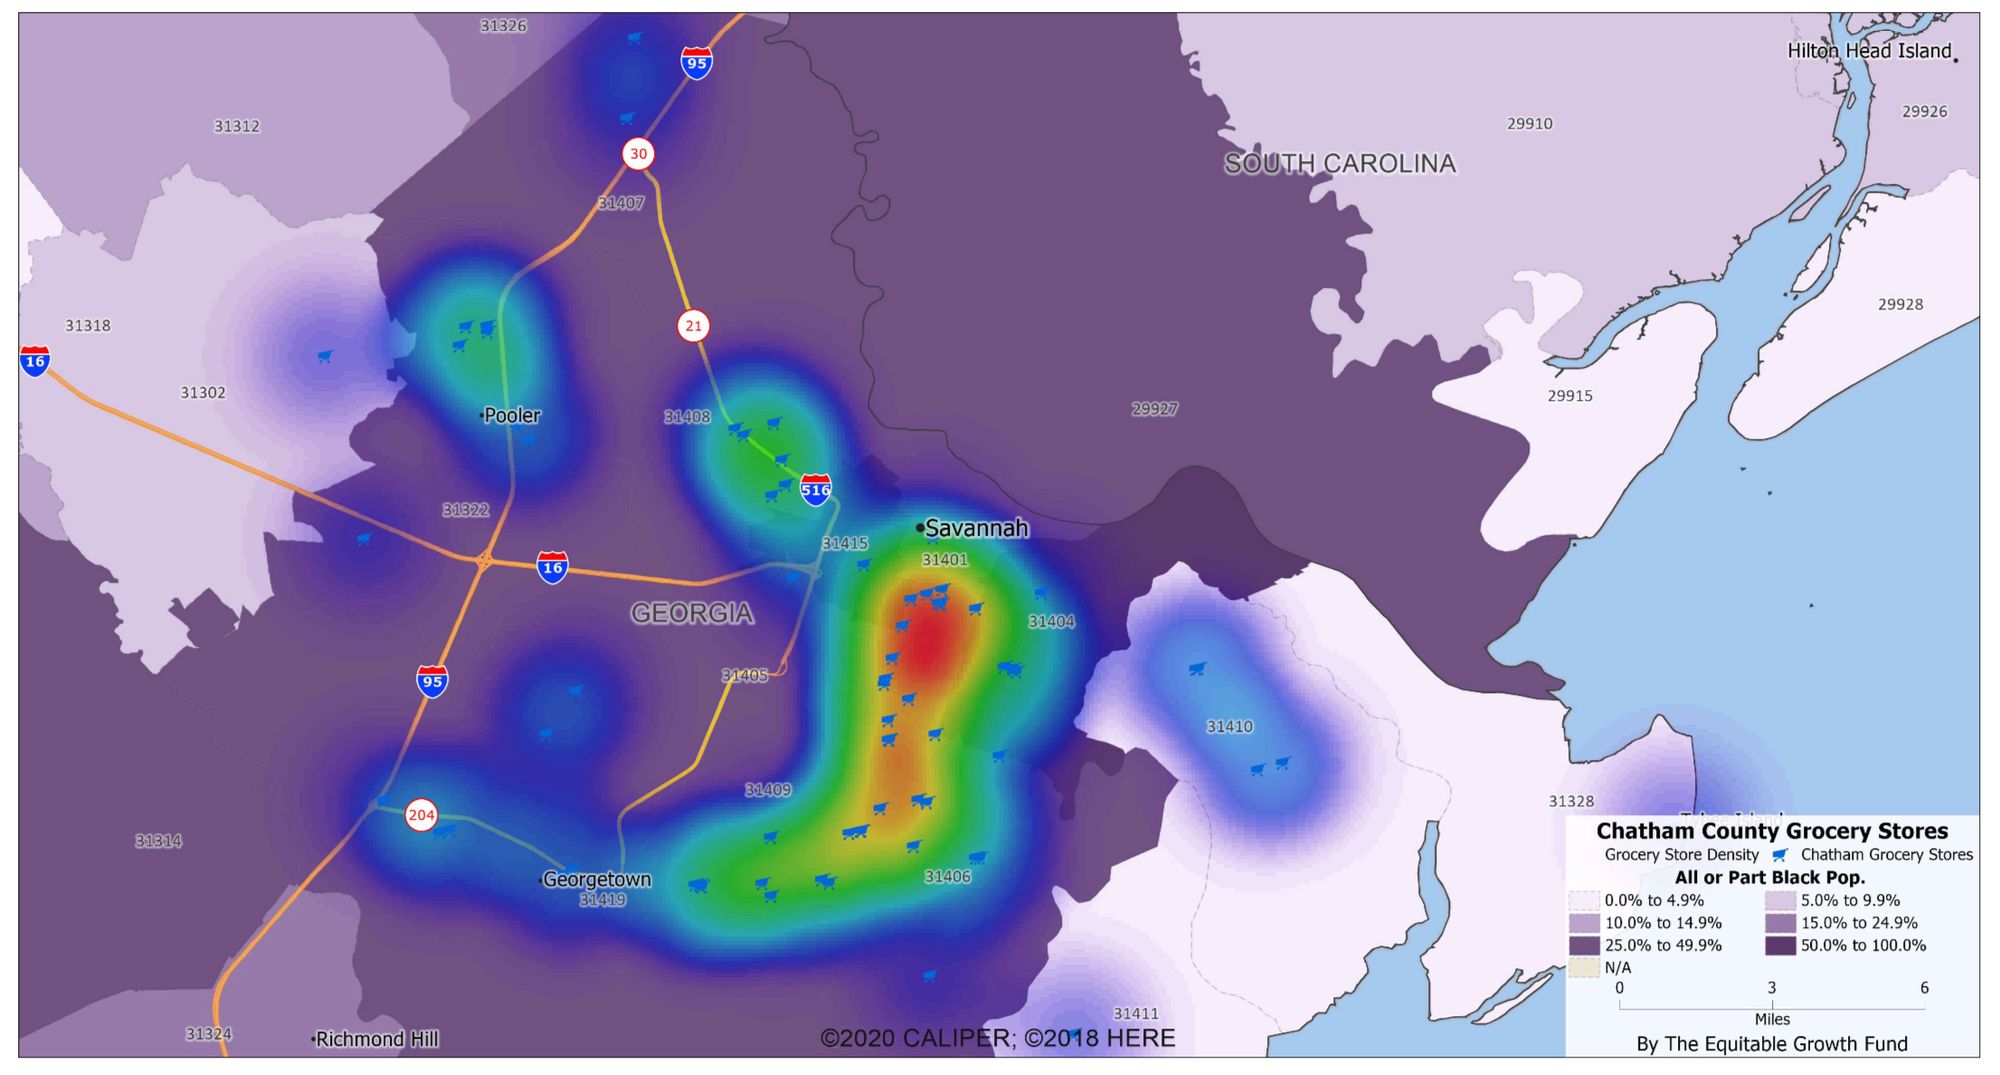
Identifying these disparities is a critical step toward shaping a more equitable Georgia. The aim is to expose these issues and collectively work towards a Georgia that assures fair access to vital services for all its citizens.
Fulton County Banks/Credit Deserts
In the following sections, we will delve into these infrastructural components. We will explore the challenges, uncover the systemic issues, and suggest actionable strategies to work towards infrastructural equity for the Black population in Georgia.
There is a positive correlation between the percentage of the Black population and the percentage of severe housing problems across the counties in the dataset. As the percentage of the Black population increases, the percentage of severe housing problems also tends to increase.
However, the relationship is not strictly linear, and the data has quite a bit of variation. This suggests that while there is a moderate correlation, other factors not included in this dataset may also influence the percentage of severe housing problems.
Georgia Percent Severe Housing Problems
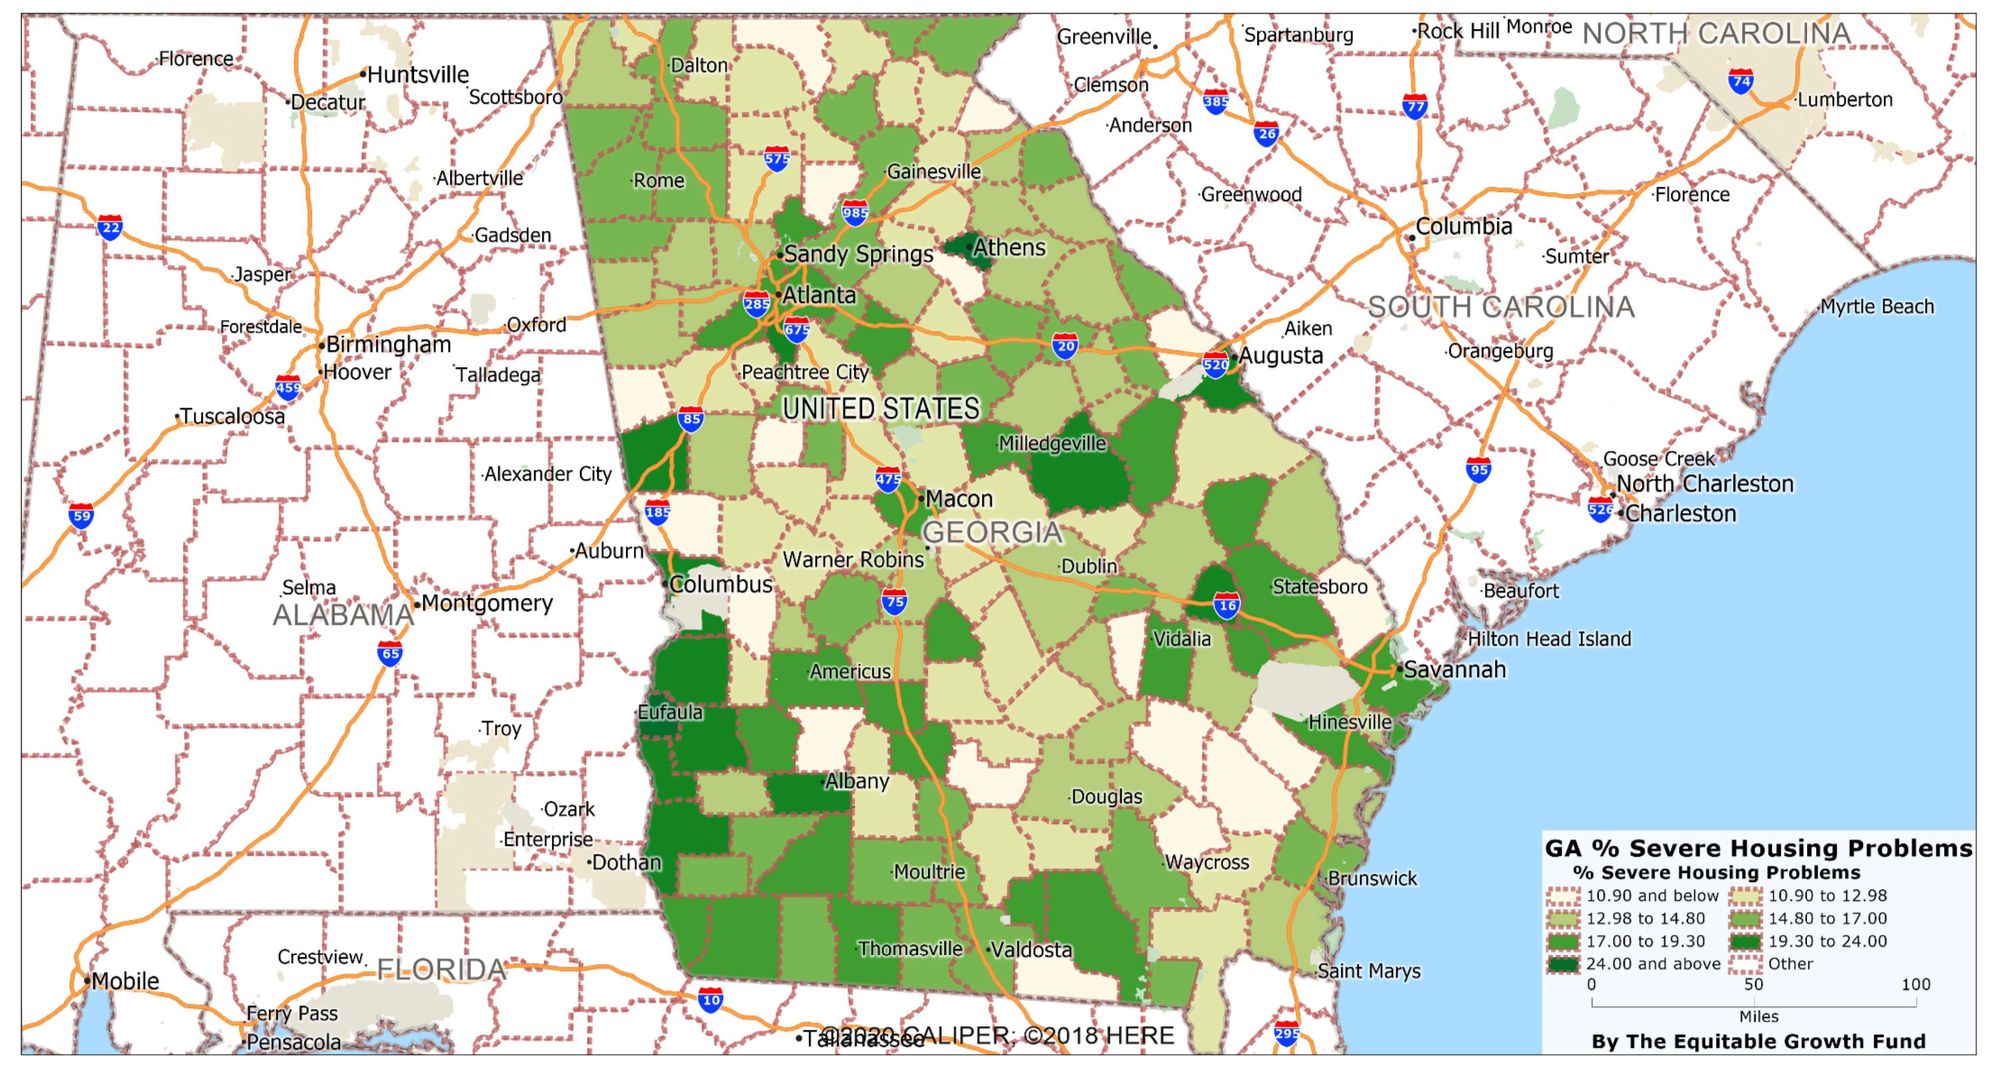
The data suggest counties with more Black residents tend to have more severe housing problems. However, it's important to note that this correlation does not necessarily imply causation. The reasons behind this correlation could be numerous and complex, potentially involving various socioeconomic factors, historical contexts, and policy environments. Further research would be needed to explore these factors and their potential impacts on housing problems in more detail.
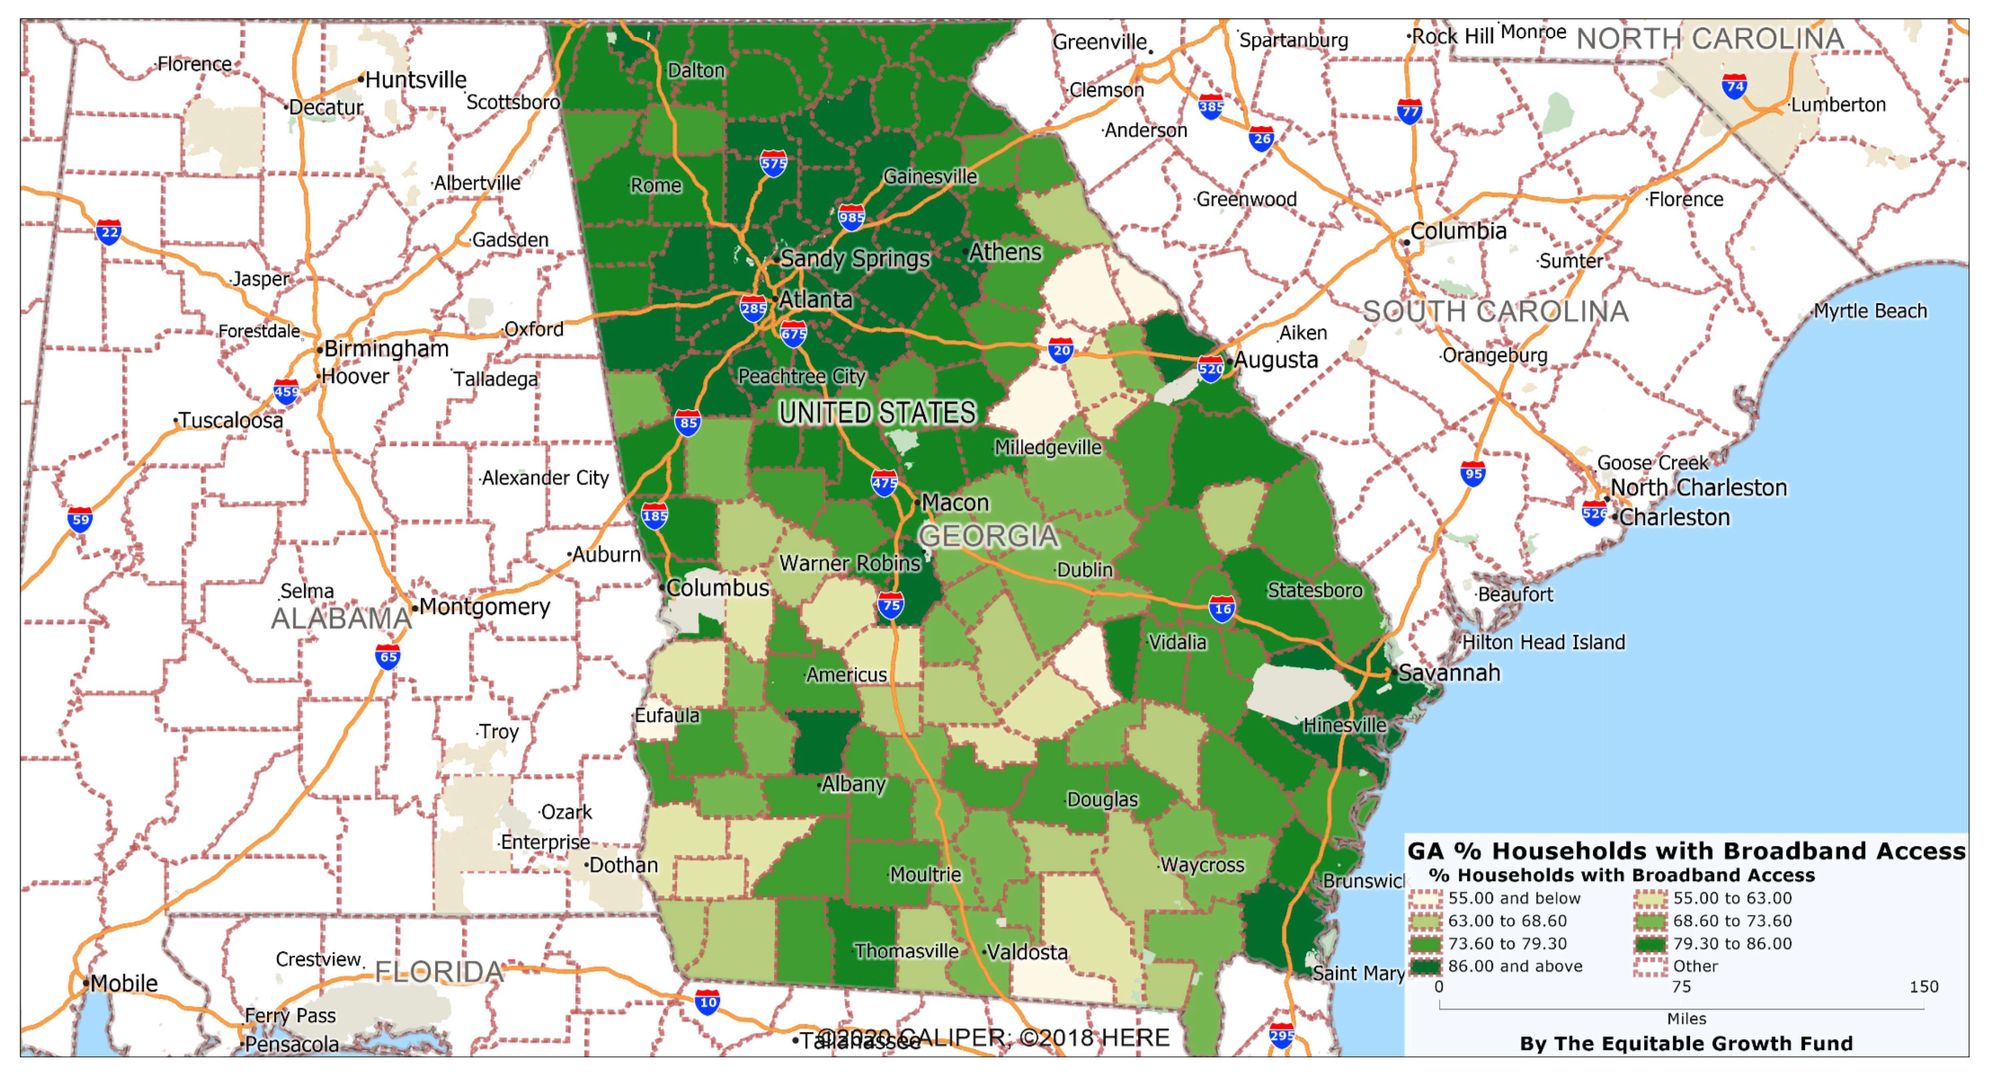
The importance of digital access cannot be understated in the 21st century. The availability of reliable broadband services profoundly impacts education, work, and social connections. Yet, digital deserts exist where this crucial service is lacking or insufficient.
Georgia Percent Households with Broadband Access
Infrastructure is not merely about roads, buildings, or services. It's about people and their capacity to live with dignity and opportunity. Together, we can strive for a Georgia where every community, regardless of race or creed, is nurtured by a strong and reliable infrastructure.
Governance Index
The political arena can be challenging for Georgia's Black community, where the levers of power often overlook their needs and silence their voices. This section will delve into the insidious issues of voter suppression and gerrymandering, which manipulate democratic processes to limit representation. It also focuses on the dire need for political representation that reflects and represents our communities' diverse demographic makeup.
In the halls of power, voices are often silenced or ignored:
- Voter Suppression: Democracy challenged at its core.
- Gerrymandering: A game where rules are twisted.
- Political Representation: A need for faces that reflect all of us.
Conclusion
The Contract with Black Georgia isn't just a document; it's a promise, a commitment, and a path forward. It's a call to action, a cry for understanding, and a demand for justice. It recognizes African-Americans' multifaceted challenges and lays out a strategic framework to remove obstacles to self-determination and prosperity.
The journey ahead is long, and the path may be challenging. But a more equitable Georgia is possible with collective resolve, empathy, and foresight. The Contract is more than words; it's a tangible symbol of hope and a guide to a better future for Black Georgians.