
Washington DC's Resource Vulnerability Index: A Closer Look at Resource Accessibility
The Resource Vulnerability Index (RVI) reveals resource disparities in Washington, DC. Some zip codes have high RVI scores, while others face critical vulnerability. Addressing socioeconomic disparities and healthcare inequities is crucial for a more equitable future.
When it comes to measuring resource accessibility within a given region, a key tool at our disposal is the Resource Vulnerability Index (RVI). The RVI quantifies and compares the availability and accessibility of five essential resources across different zip codes. Today, we'll specifically focus on Washington, DC.
The five resource categories we're exploring are:
- Banks
- Pharmacies
- Hospitals
- Grocery Stores
- Recreational Facilities
Understanding the RVI
To calculate the RVI, we assign a certain weight to each resource category. These weights reflect their relative importance to the general population.
Here's the weightage breakdown:
- Banks: 10%
- Pharmacies: 20%
- Hospitals: 30%
- Grocery Stores: 25%
- Recreational Facilities: 15%
For instance, hospitals hold more weight due to their life-saving role in society.
To calculate the RVI for a particular zip code, we multiply the availability of each resource by its respective weight. Summing up these weighted scores gives us the RVI.
RVI for Washington DC: A Snapshot
To give you a better idea of how the RVI works, let's delve into the data from Washington, DC.
Here's the comprehensive RVI table for the region:
RVI Table for Washington DC
| ZIP Code | Banks | Pharmacies | Hospitals | Grocery Stores | Recreational Facilities | RVI |
|---|---|---|---|---|---|---|
| 20001 | 10 | 9 | 1 | 19 | 1 | 10.7 |
| 20002 | 14 | 15 | 1 | 36 | 4 | 17.6 |
| 20003 | 12 | 11 | 0 | 13 | 1 | 9.2 |
| 20004 | 8 | 2 | 0 | 2 | 0 | 3.0 |
| 20005 | 16 | 8 | 0 | 4 | 1 | 7.7 |
| 20006 | 22 | 3 | 0 | 3 | 0 | 5.2 |
| 20007 | 11 | 7 | 1 | 8 | 3 | 8.7 |
| 20008 | 10 | 7 | 0 | 4 | 1 | 6.3 |
| 20009 | 10 | 13 | 0 | 12 | 3 | 10.0 |
| 20010 | 9 | 10 | 1 | 15 | 2 | 11.0 |
| 20011 | 1 | 9 | 0 | 24 | 7 | 12.6 |
| 20012 | 0 | 6 | 0 | 4 | 1 | 3.9 |
| 20015 | 9 | 3 | 0 | 2 | 1 | 4.5 |
| 20016 | 10 | 7 | 1 | 5 | 2 | 7.6 |
| 20017 | 1 | 6 | 0 | 2 | 2 | 3.8 |
| 20018 | 6 | 7 | 0 | 4 | 1 | 5.2 |
| 20019 | 3 | 5 | 0 | 7 | 6 | 6.4 |
| 20020 | 11 | 12 | 0 | 4 | 5 | 8.5 |
| 20024 | 2 | 3 | 0 | 3 | 1 | 3.0 |
| 20032 | 3 | 10 | 3 | 6 | 3 | 9.5 |
| 20036 | 24 | 10 | 0 | 2 | 1 | 9.2 |
| 20037 | 7 | 11 | 1 | 5 | 0 | 8.0 |
| 20049 | 1 | 0 | 0 | 0 | 0 | 0.1 |
| 20060 | 0 | 0 | 1 | 0 | 0 | 0.3 |
| 20071 | 1 | 1 | 0 | 0 | 0 | 0.3 |
| 20310 | 0 | 1 | 0 | 0 | 0 | 0.2 |
| 20422 | 0 | 1 | 1 | 0 | 0 | 0.5 |
| 20431 | 2 | 0 | 0 | 0 | 0 | 0.2 |
| 20433 | 4 | 0 | 0 | 0 | 0 | 0.4 |
| 20551 | 3 | 0 | 0 | 0 | 0 | 0.3 |
| 20577 | 1 | 0 | 0 | 0 | 0 | 0.1 |
| 20580 | 1 | 0 | 0 | 0 | 0 | 0.1 |
RVI Analysis
The highest RVI (17.6) is in the 20002 zip code, indicating that this area has the highest availability and accessibility of essential resources. Conversely, the 20049, 20060, 20071, 20310, 20431, 20577, and 20580 zip codes have the lowest RVI (≤0.3), suggesting significant resource vulnerability in these areas.
Mapping Washington's RVI
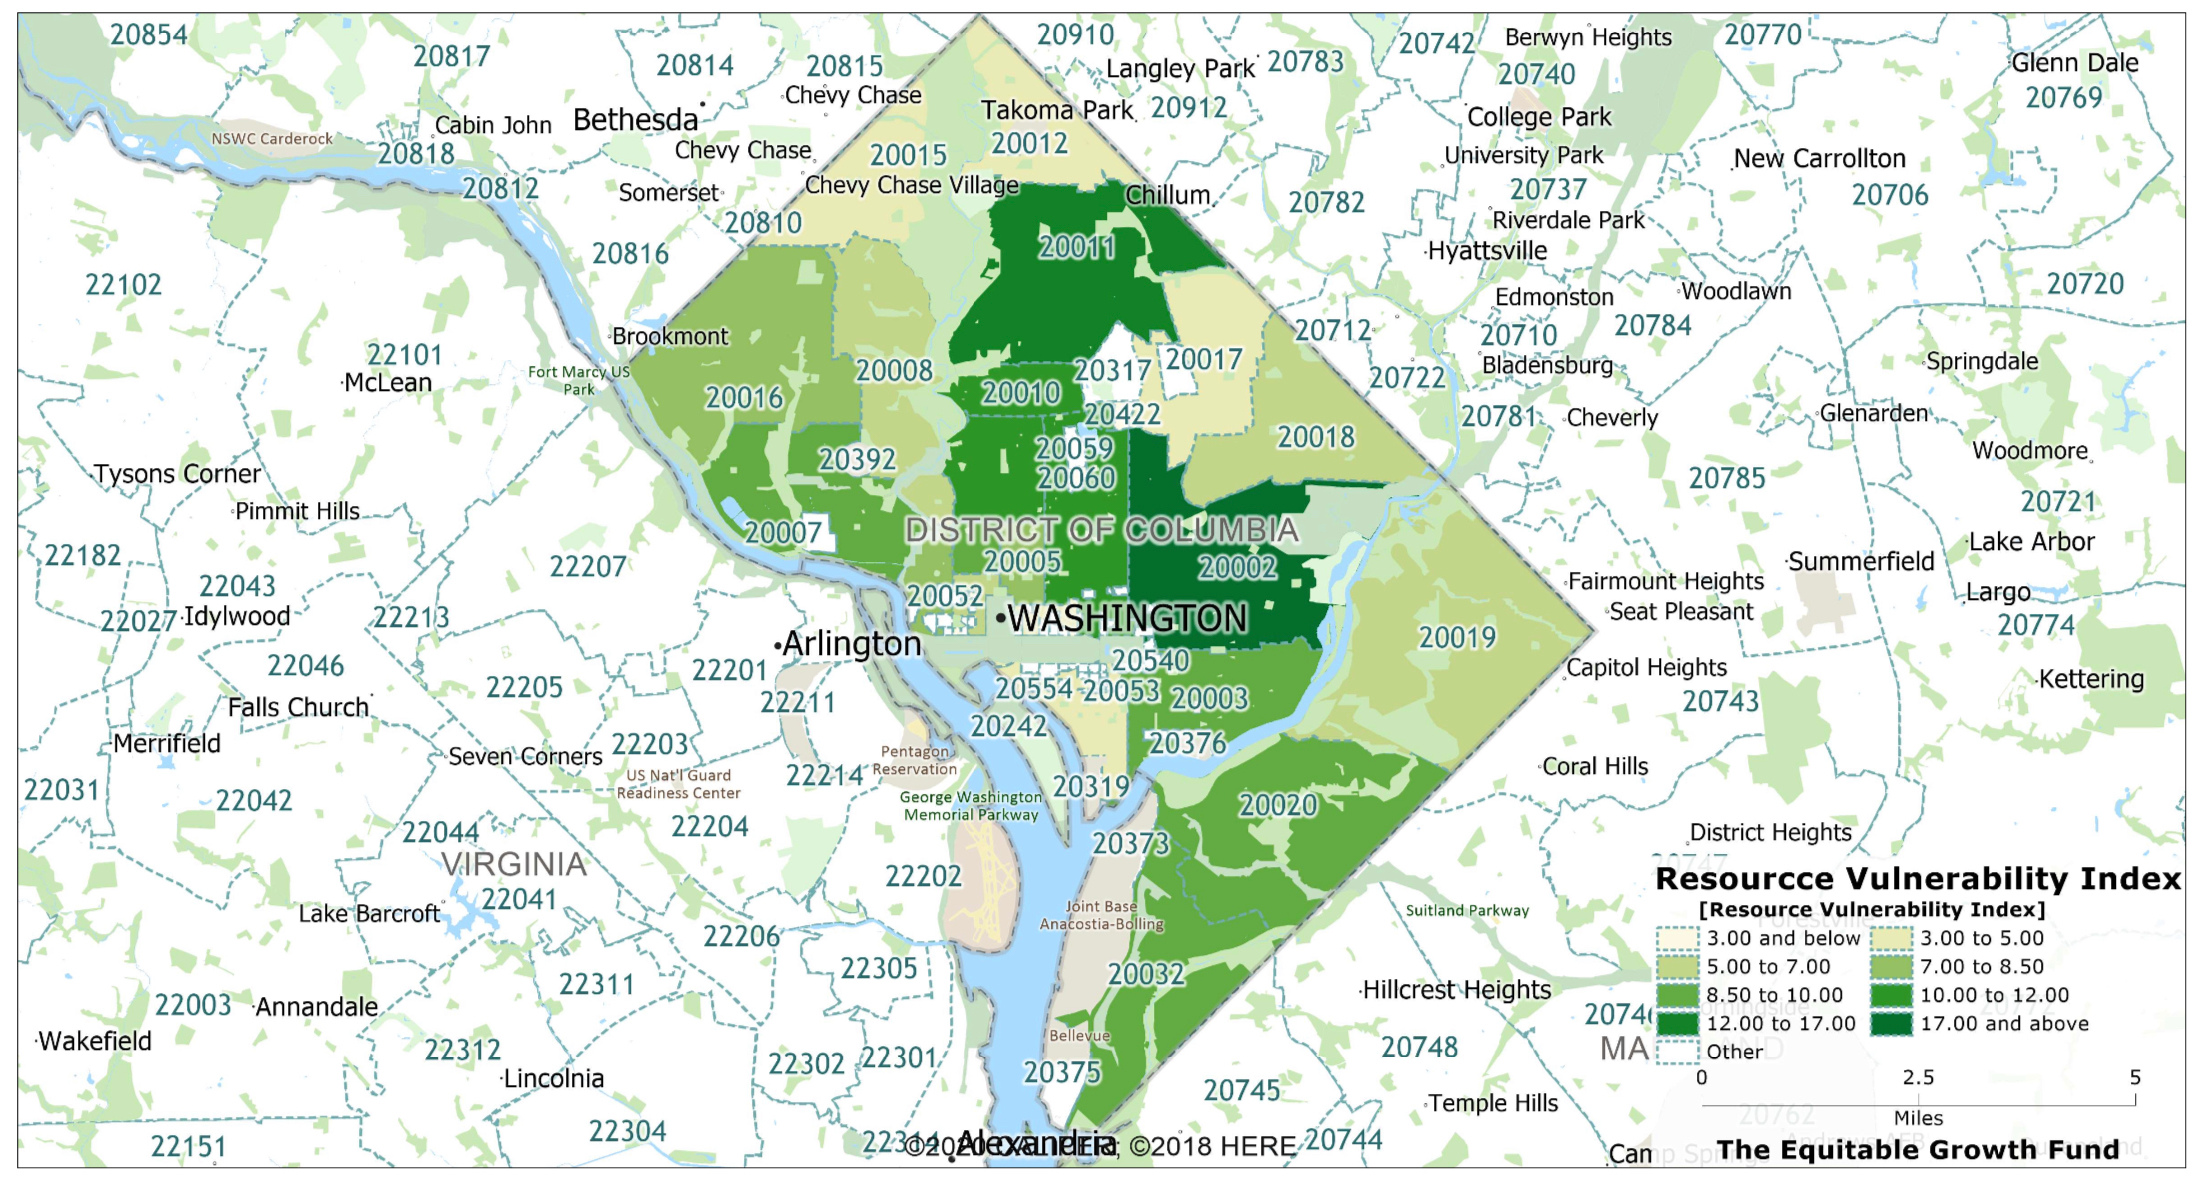
The Resource Vulnerability Index (RVI) is a metric that quantifies the availability and accessibility of essential resources within different zip codes. These resources include Banks, Pharmacies, Hospitals, Grocery Stores, and Recreational Facilities.
Our analysis of Washington, D.C., shows a significant variation in the RVI, representing an uneven resource distribution across the city. For instance, certain areas, like zip code 20002, are resource-rich with a high RVI, while others, such as 20049 and 20060, have a critically low RVI, indicating high resource vulnerability.
Moreover, it's important to mention that this index sheds light on the number of resources and implicitly on the socio-economic disparities across neighborhoods. A higher concentration of pharmacies in non-black neighborhoods implies a systemic inequity in healthcare access, reflected in the RVI. These discrepancies necessitate targeted interventions to improve resource distribution and accessibility.
Mapping Washington Pharmacy Resources
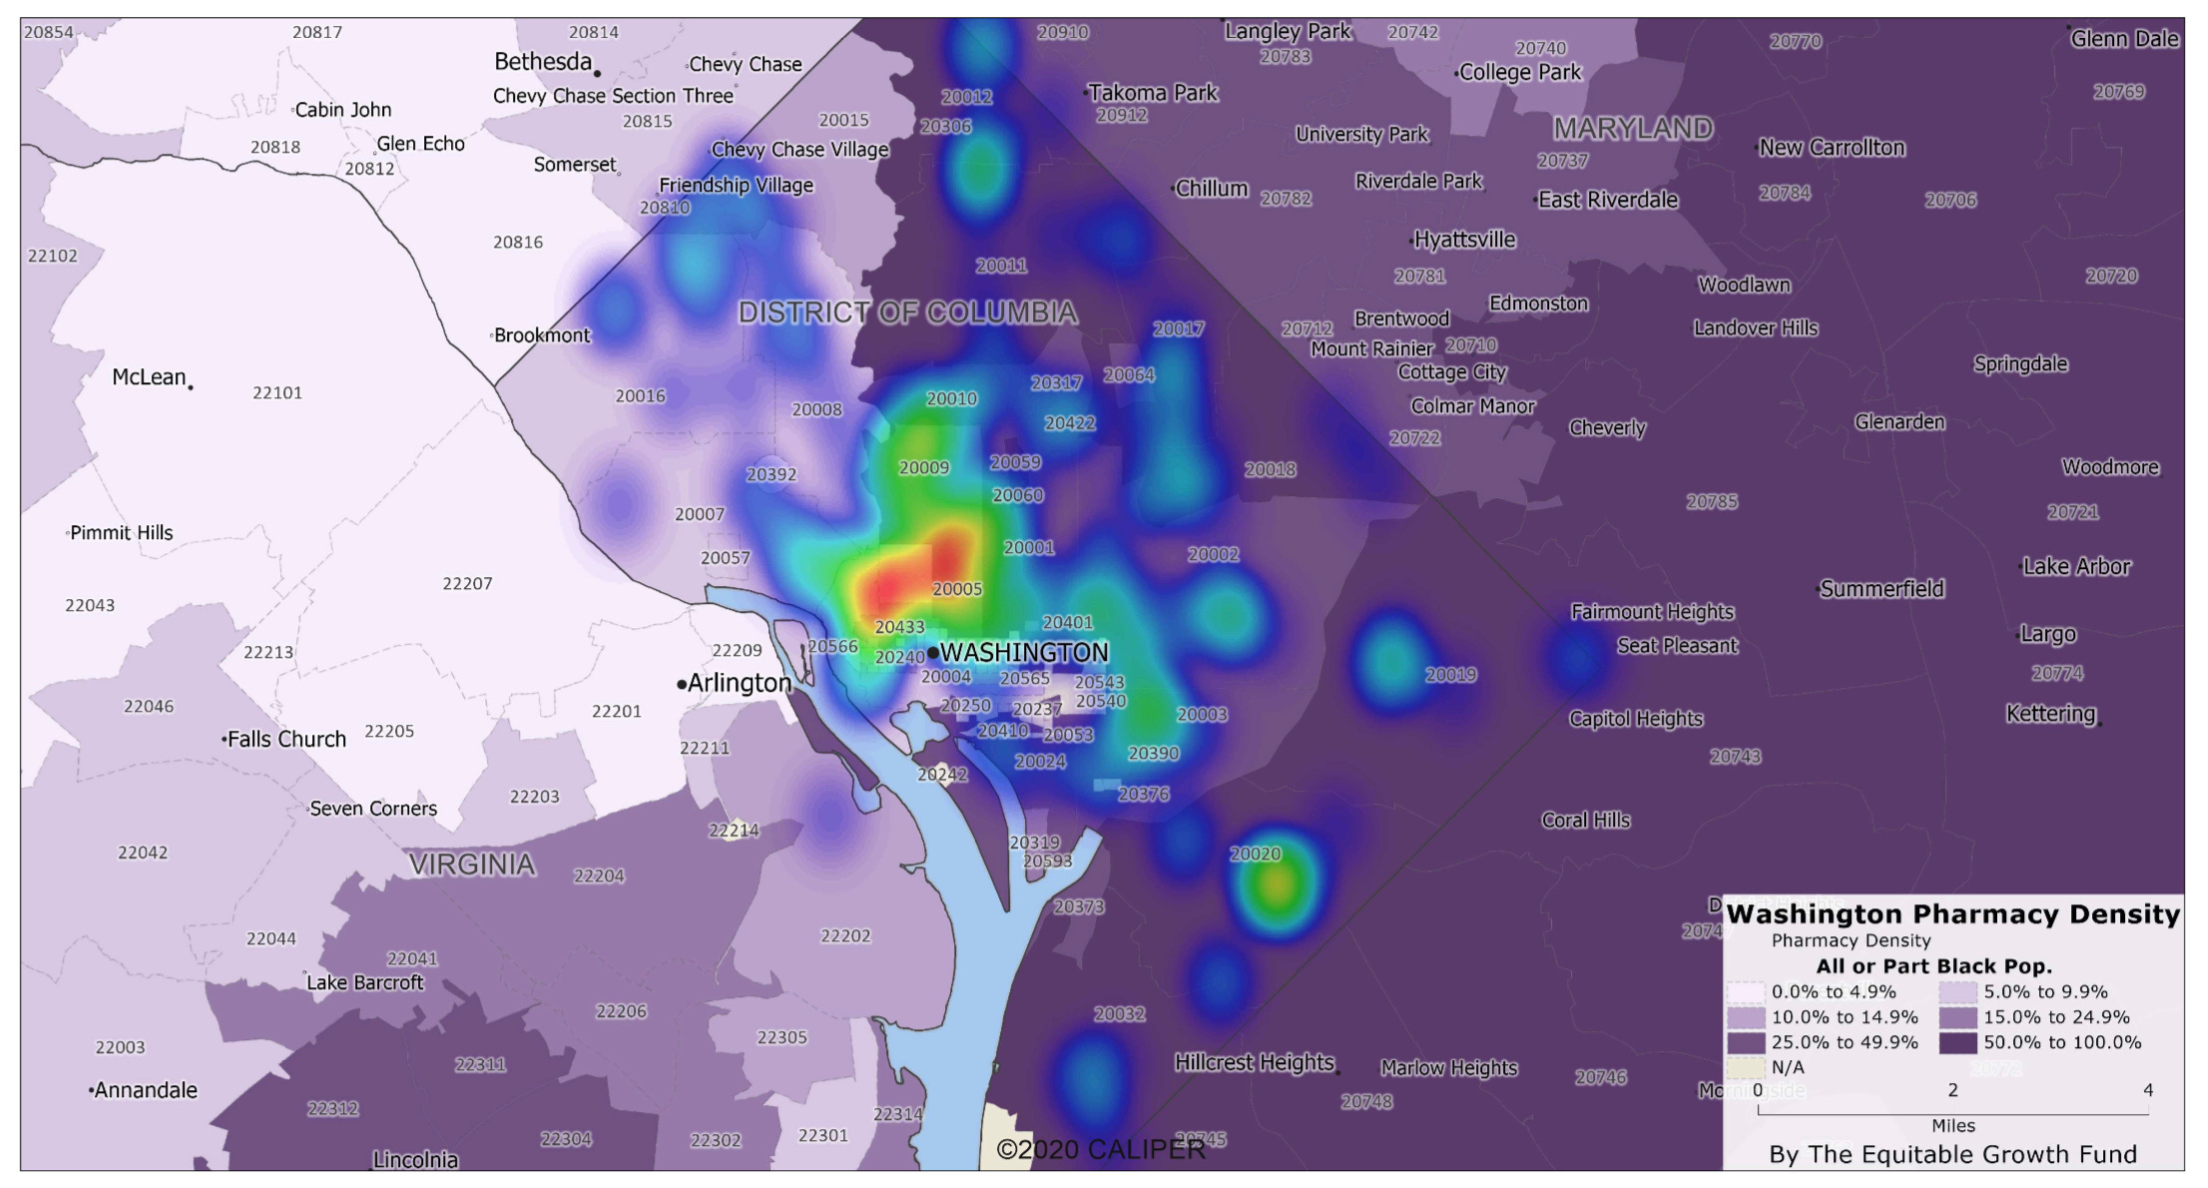
Pharmacy distribution across Washington DC's zip codes varies greatly, with high concentrations in areas like 20002, 20003, and 20037 indicating robust healthcare infrastructure. Conversely, zip codes such as 20004, 20006, 20431, 20551, 20577, and 20580 have scarce or no pharmacies, suggesting potential challenges in accessing essential healthcare services.
This uneven spread could impact residents' health, especially in areas with limited pharmacy access, crucial for managing chronic conditions, vaccinations, and preventive healthcare. If these under-resourced zip codes correspond to predominantly black neighborhoods, this may signal systemic health inequalities.
Such disparities can arise from historical, economic, or institutional biases, leading to 'healthcare deserts' in these neighborhoods. Addressing this imbalance is vital for health equity and involves incentivizing pharmacy openings in underserved areas, improving transportation, or implementing delivery pharmacy services.
Mapping Washington Hospital Resources
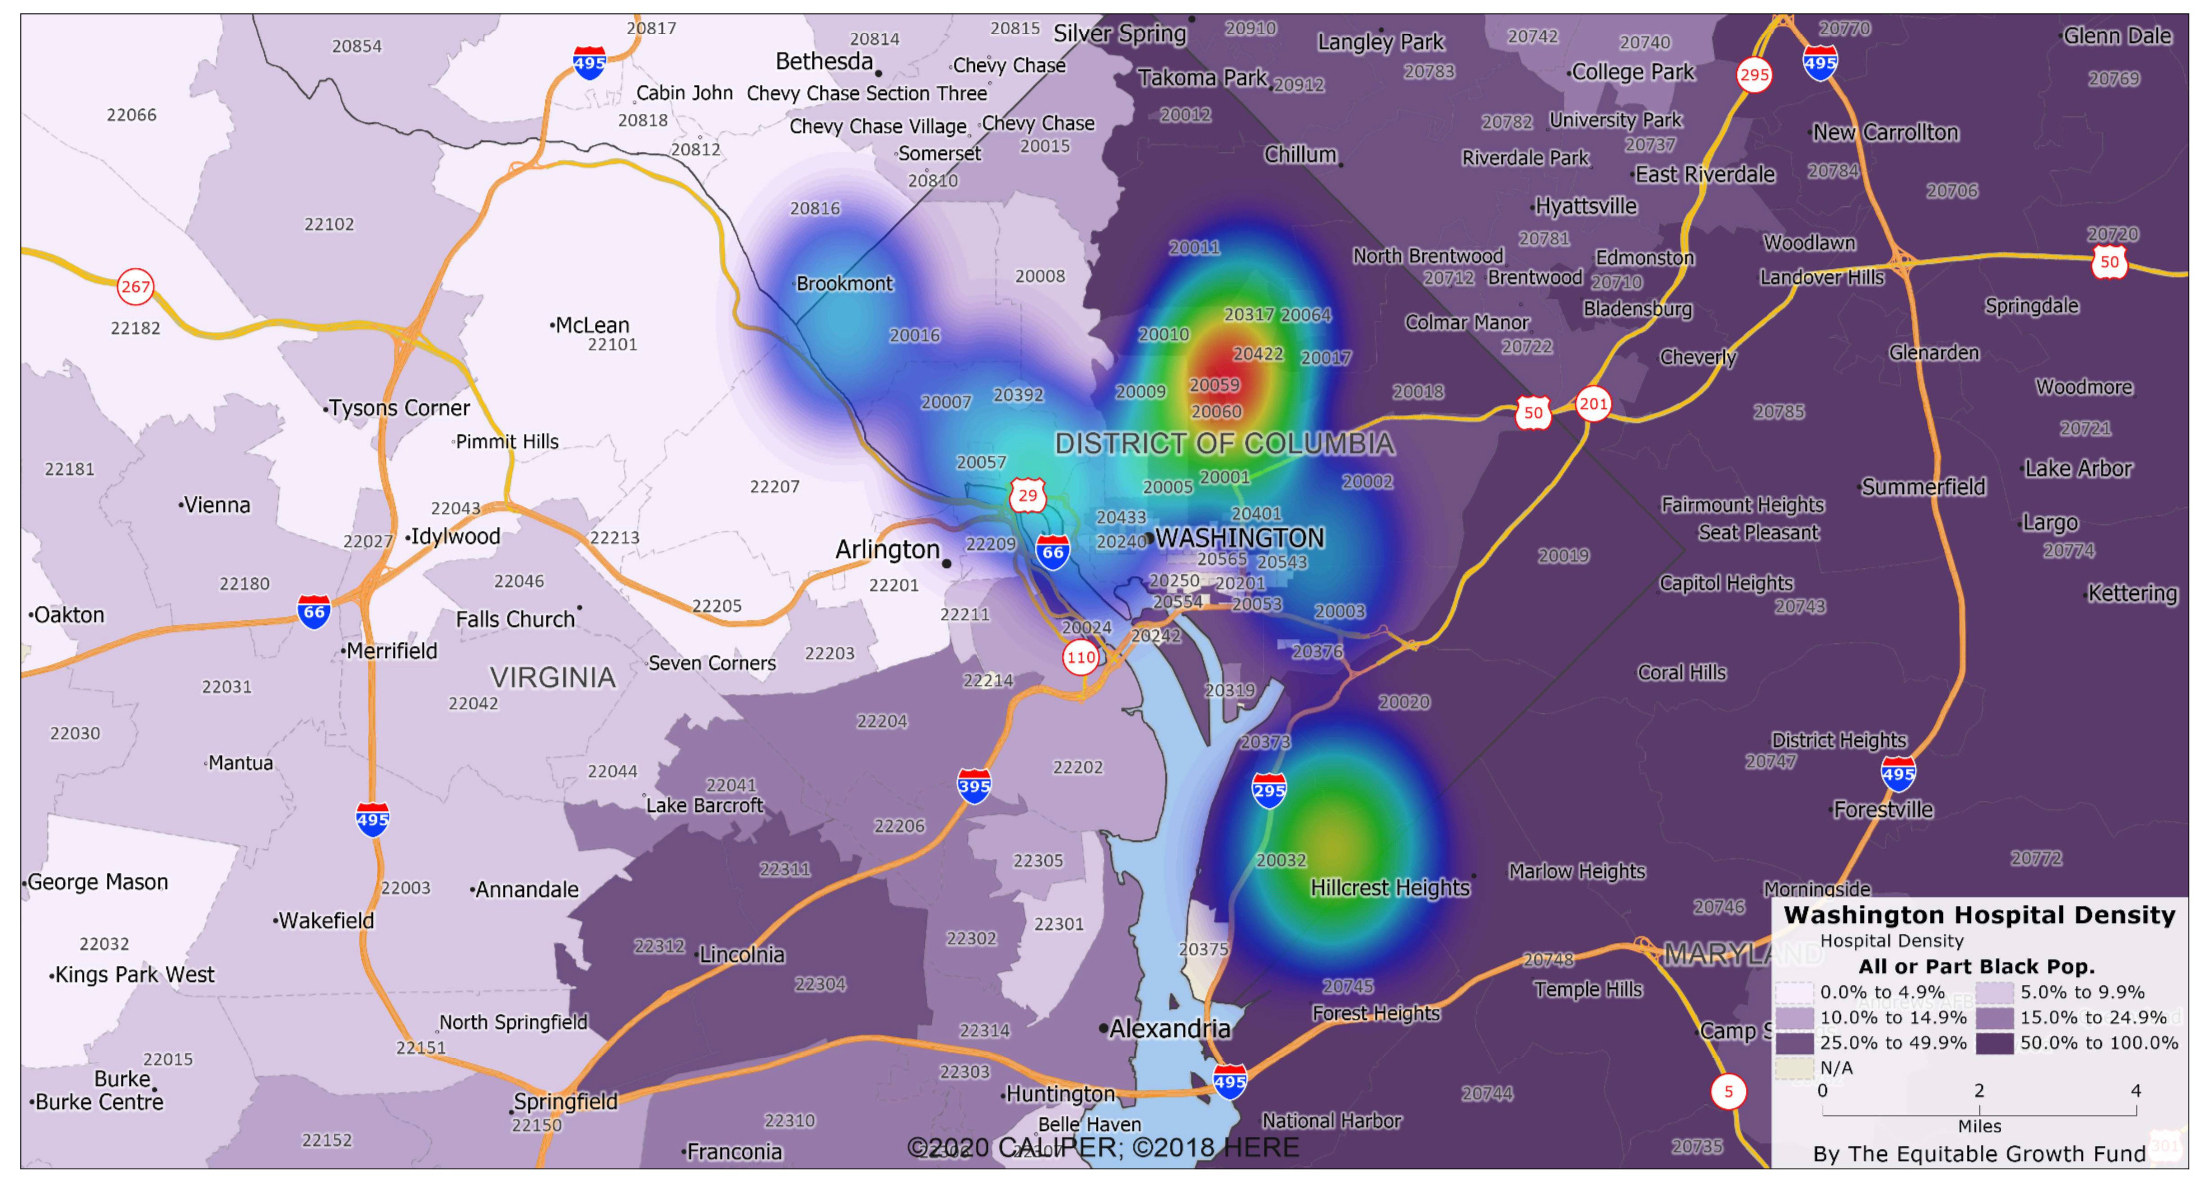
Analyzing the data shows a stark disparity in hospital access across the Washington DC zip codes. While some zip codes have at least one hospital, many do not have any, potentially leading to significant health disparities.
The availability of hospitals is concentrated in zip codes 20001, 20002, 20007, 20010, 20016, 20032, and 20037, each with one hospital. Zip code 20032 has the highest number of hospitals at three. Unfortunately, many zip codes, such as 20003, 20004, 20005, 20006, and many others extending to 20580, show no presence of hospitals at all.
The lack of hospitals in many zip codes and a higher concentration of pharmacies in non-black neighborhoods indicates potential health resource allocation disparities. This could mean longer travel times to hospitals for residents in those areas, delayed care, and potentially poorer health outcomes. Further research and policies should be explored to ensure equitable access to essential healthcare resources, especially hospitals, in all neighborhoods regardless of racial or socioeconomic demographics.
Mapping Washington Food Resources
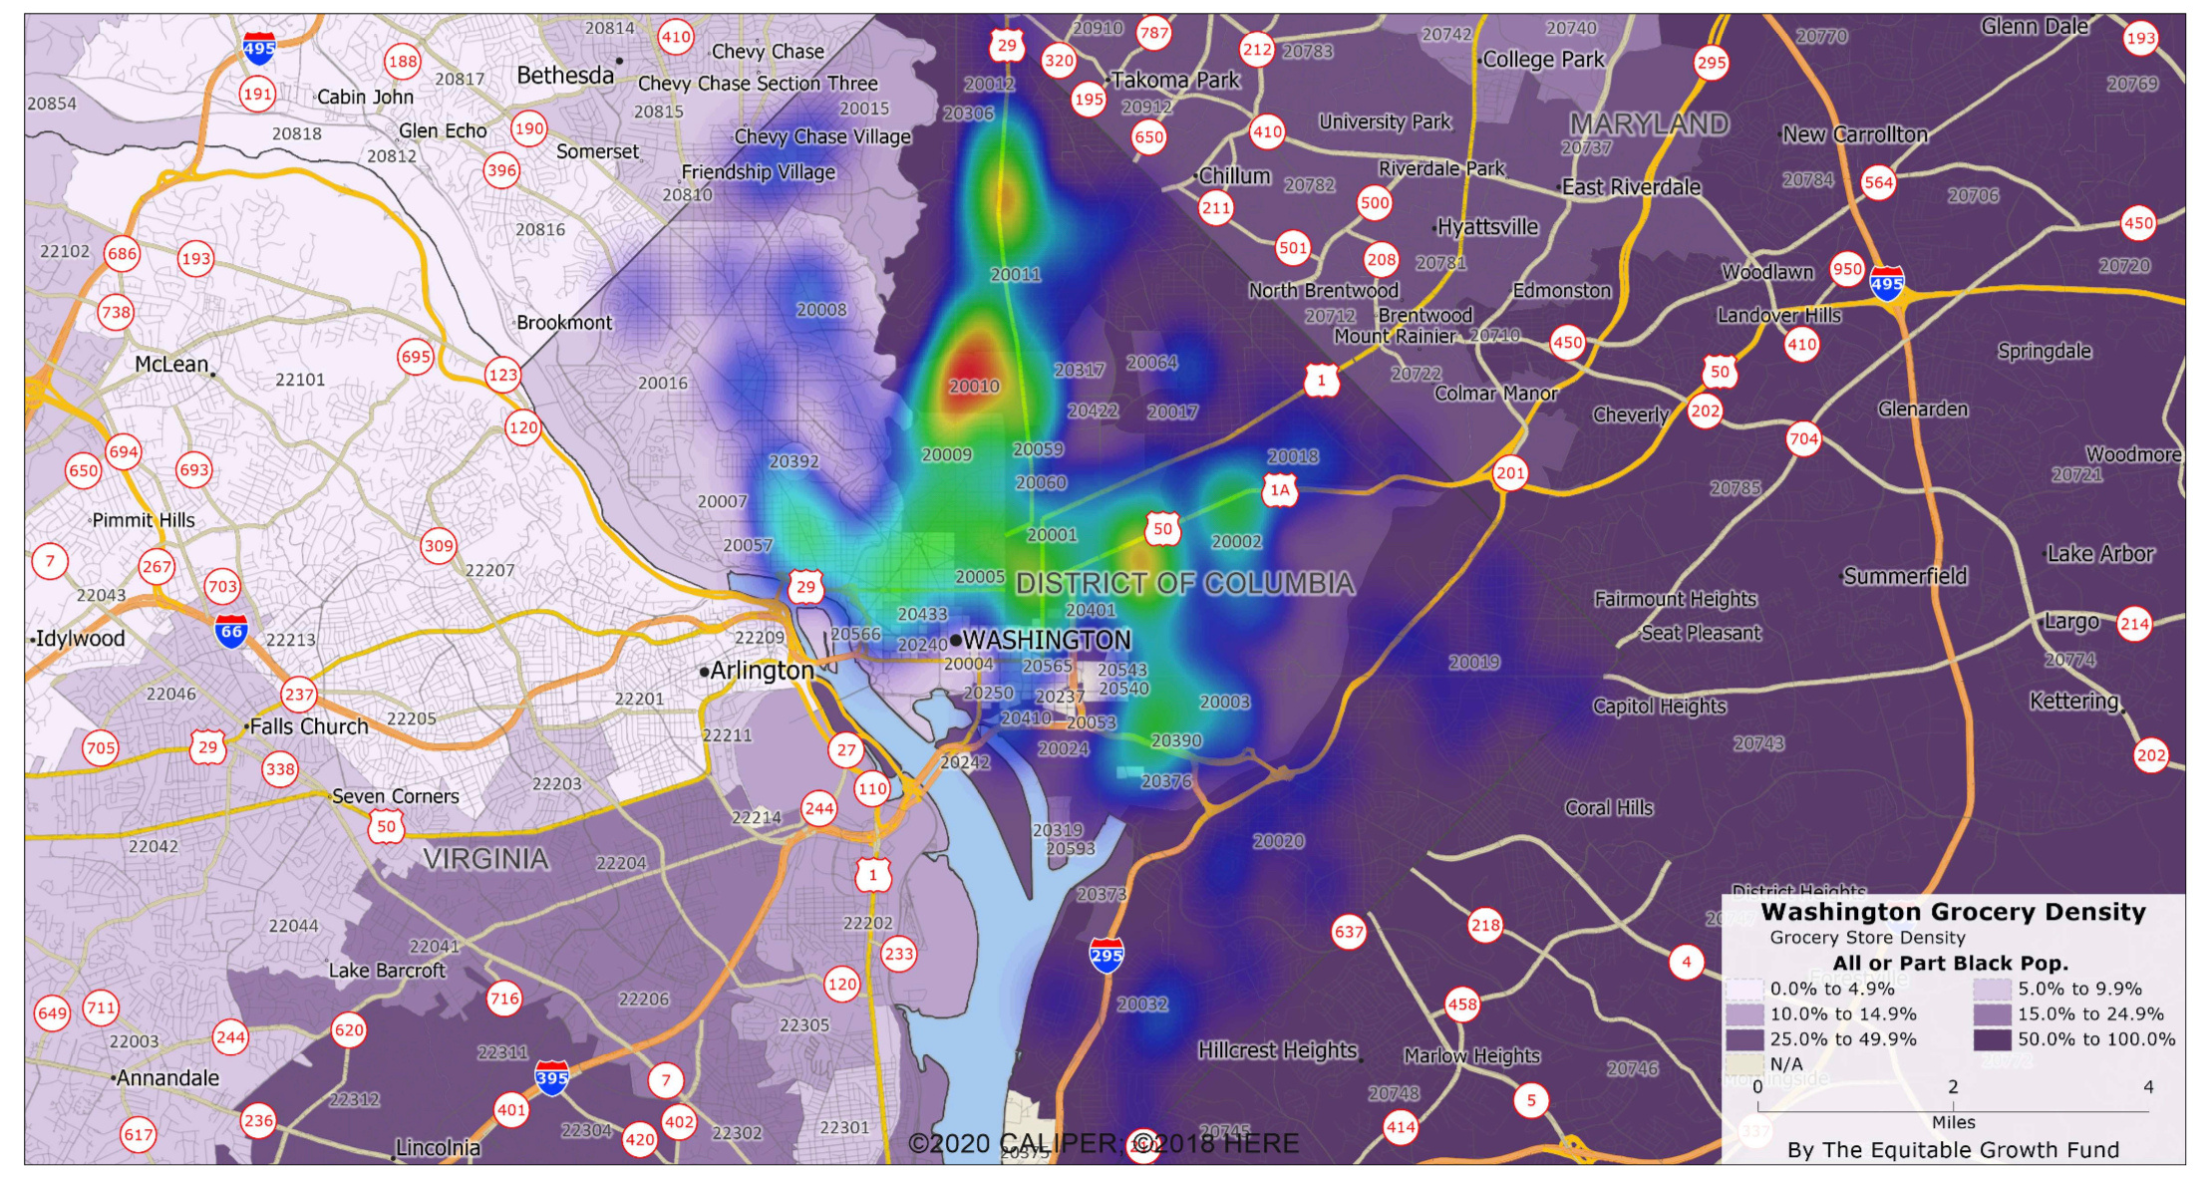
The Resource Vulnerability Index (RVI) analysis for various zip codes in Washington, DC, reveals significant disparities in the distribution of resources, including grocery stores, which are critical for food access. Areas like zip code 20002 have abundant grocery stores (36), indicating good food accessibility. This high concentration ensures that residents have a variety of options to choose from, improving their nutritional intake.
Contrarily, some zip codes, such as 20049, 20060, 20071, 20310, 20431, 20577, and 20580, have no grocery stores, indicating a food desert situation where the residents might face challenges accessing fresh and affordable food. This often forces residents to rely on convenience stores or fast-food restaurants, which do not offer the same variety or quality of foods as grocery stores.
Mapping Washington Bank Resources
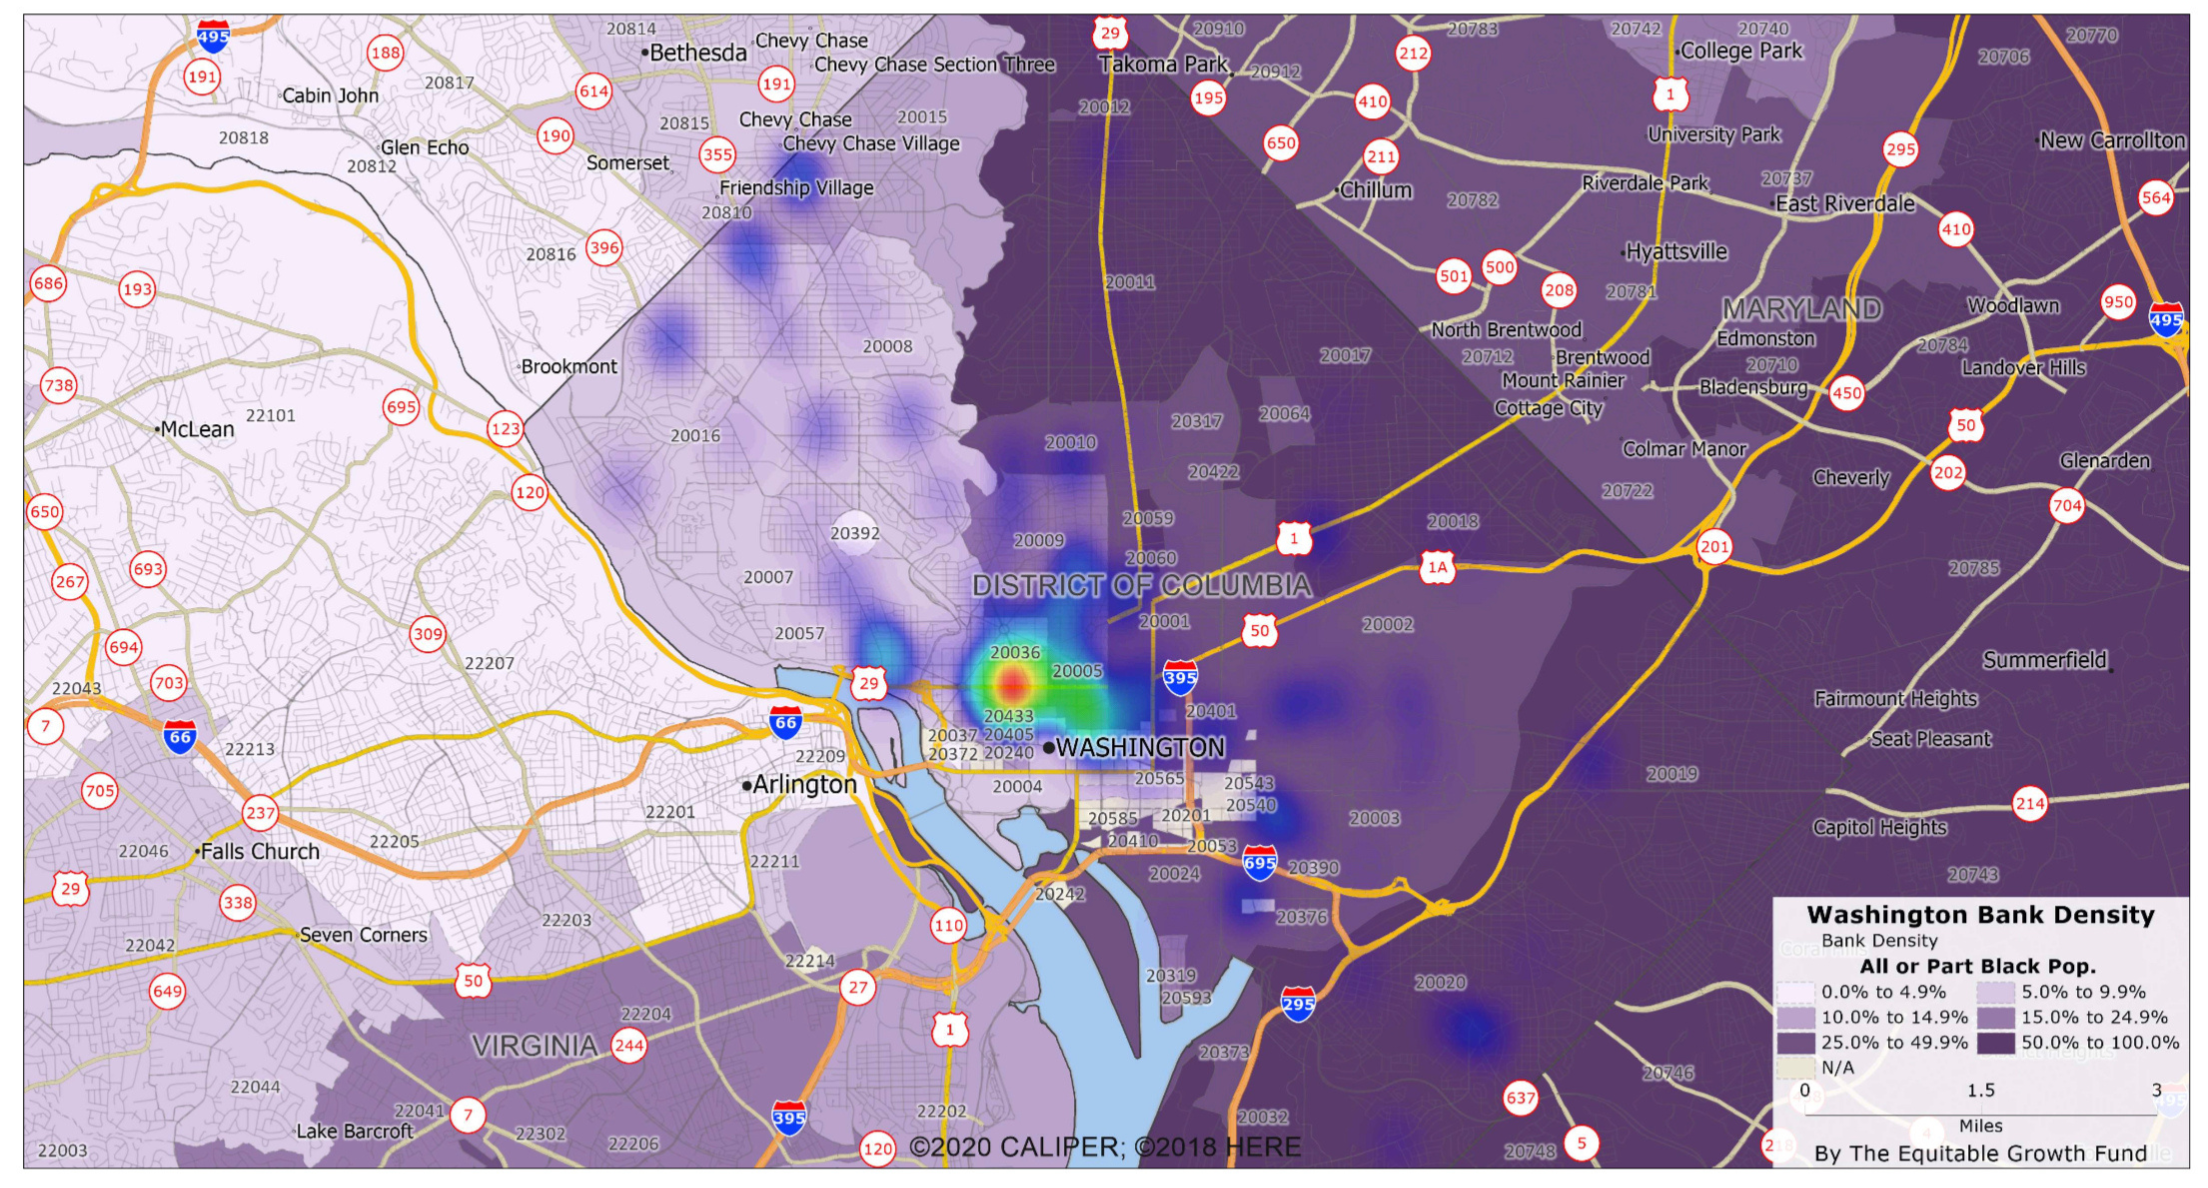
Bank access varies significantly across the various zip codes in Washington, DC, as per the RVI data. The highest concentration of banks is in zip code 20036, with a count of 24. This suggests that residents in this area likely have the easiest access to banking services.
Conversely, several zip codes like 20049, 20060, 20071, 20310, 20431, 20422, 20551, 20577, and 20580 have limited access to banks with counts as low as 0 or 1. These areas represent regions with significant banking deserts, indicating potential financial services challenges for residents.
The distribution of banks in these areas could be influenced by various factors, including socioeconomic status, demographic composition, and neighborhood infrastructure. For example, areas with higher income levels or larger commercial hubs often attract more banks.
Mapping Washington Recreational Resources
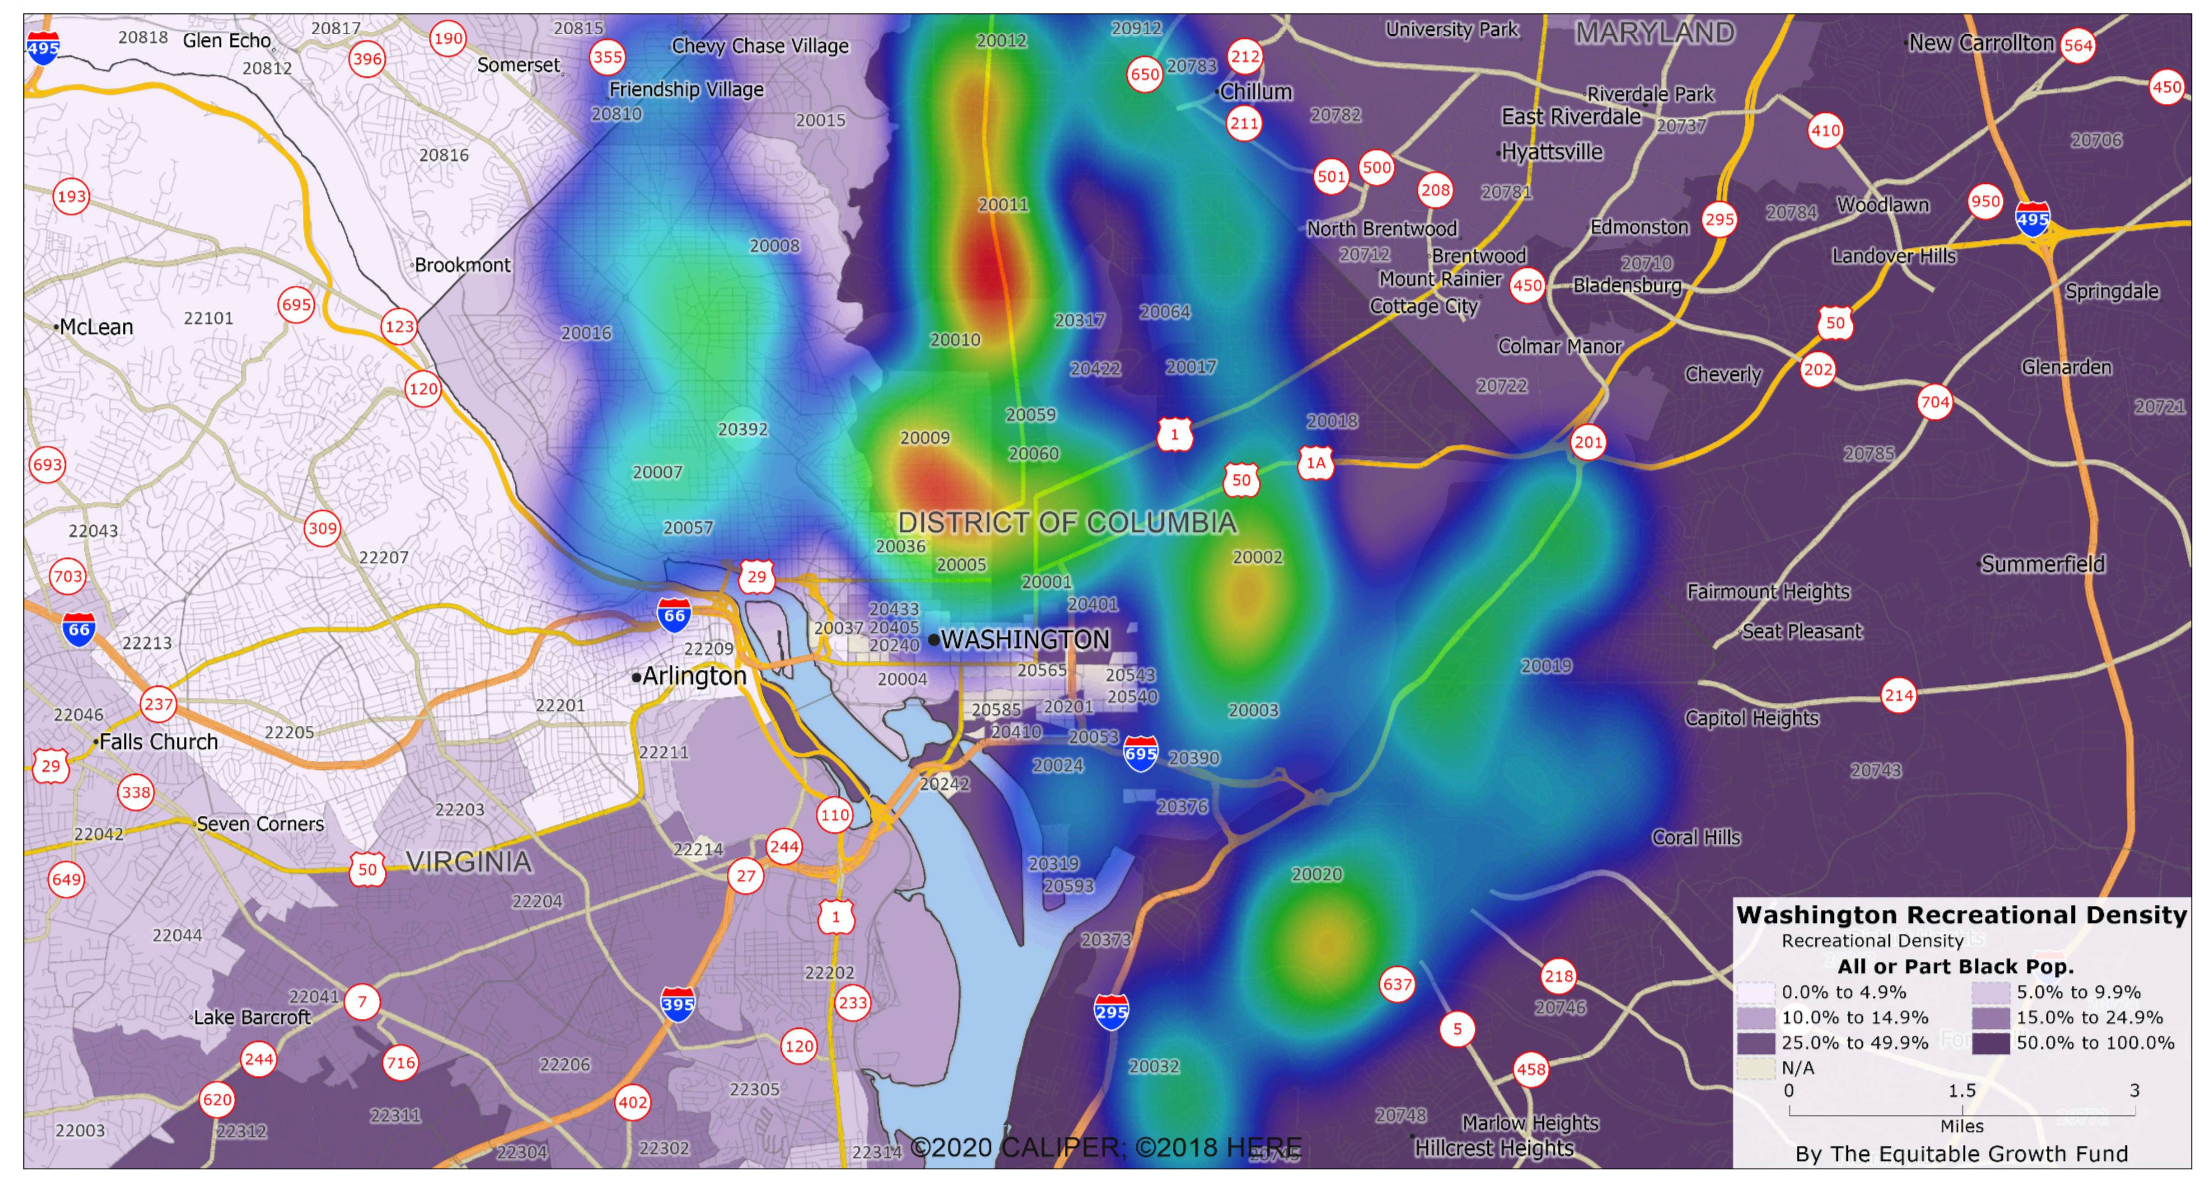
Recreational resources contribute significantly to the quality of life in a given zip code. Analysis of Washington DC's recreational resources by zip code reveals some stark disparities. For instance, zip code 20011 stands out with 7 recreational facilities, the highest among the analyzed areas. This might indicate a more lively or family-friendly neighborhood.
However, zip codes such as 20004, 20006, 20037, 20049, 20060, 20071, 20310, 20422, 20431, 20433, 20551, 20577, and 20580 have no recreational facilities, reflecting a deficiency in recreational infrastructure.
It's worth noting that recreational facilities might also suggest a neighborhood's relative affluence, as these facilities require investment and upkeep. Unfortunately, this disparity may correlate with racial demographics and neighborhood wealth inequalities. For example, if the neighborhoods with few or no recreational facilities are predominantly black, it could suggest systemic underinvestment in these areas.
This analysis of recreational resources thus underscores the need to look beyond just essential services like pharmacies when evaluating neighborhood resources and pushing for equitable resource distribution across zip codes.
Wrapping Up
Remember, our understanding of resource accessibility is a living, breathing entity. It evolves with time as new data come to light. These findings are thus subject to changes as more comprehensive data become available, allowing us to refine the RVI and ensure its relevance and effectiveness continually.
Our journey into the world of the RVI doesn't stop here. Stay tuned as we take this exploration to new heights, uncovering vital insights that help us shape a more equitable future.